Title 40
SECTION 86.115-78
86.115-78 EPA dynamometer driving schedules.
§ 86.115-78 EPA dynamometer driving schedules.(a) The driving schedules for the Urban Dynamometer Driving Schedule, US06, SC03, and the New York City Cycles are specified in appendix I of this part. The driving schedules are defined by a smooth trace drawn through the specified speed vs. time relationships. They each consist of a distinct non-repetitive series of idle, acceleration, cruise, and deceleration modes of various time sequences and rates.
(b) The driver should attempt to follow the target schedule as closely as possible (refer to § 86.128 for additional cycle driving instructions). The speed tolerance at any given time for these schedules, or for a driver's aid chart approved by the Administrator, are as follows:
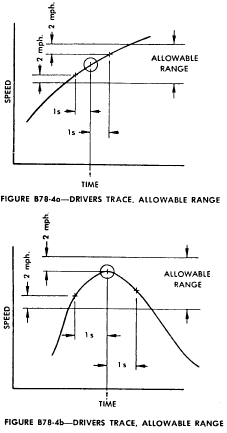
(1) The upper limit is 2 mph (3.2 km/h) higher than the highest point on the trace within 1 second of the given time.
(2) The lower limit is 2 mph (3.2 km/h) lower than the lowest point on the trace within 1 second of the given time.
(3)(i) Speed variations greater than the tolerances (such as may occur during gear changes or braking spikes) are acceptable, provided they occur for less than 2 seconds on any occasion and are clearly documented as to the time and speed at that point of the driving schedule.
(ii) When conducted to meet the requirements of § 86.129-94 or § 86.153-98(d), up to three additional occurrences of speed variations greater than the tolerance are acceptable, provided they occur for less than 15 seconds on any occasion, and are clearly documented as to the time and speed at that point of the driving schedule.
(4) Speeds lower than those prescribed are acceptable, provided the vehicle is operated at maximum available power during such occurrences.
(5) When conducted to meet the requirements of § 86.129-94, § 86.132-96, § 86.146-96, or § 86.153-98(d), the speed tolerance shall be as specified above, except that the upper and lower limits shall be 4 mph (6.4 km/h).
(c) Figures B78-4(a) and B78-4(b) show the range of acceptable speed tolerances for typical points. Figure B78-4(a) is typical of portions of the speed curve which are increasing or decreasing throughout the 2-second time interval. Figure B78-4(b) is typical of portions of the speed curve which include a maximum or minimum value.
 [42 FR
32954, June 28, 1977, as amended at 43 FR 52920, Nov. 14, 1978; 58
FR 16030, Mar. 24, 1993; 59 FR 16296, Apr. 6, 1994; 79 FR 23695,
Apr. 28, 2014]
[42 FR
32954, June 28, 1977, as amended at 43 FR 52920, Nov. 14, 1978; 58
FR 16030, Mar. 24, 1993; 59 FR 16296, Apr. 6, 1994; 79 FR 23695,
Apr. 28, 2014]