§ 795.70 Indirect photolysis screening test: Sunlight photolysis in waters containing dissolved humic substances.
(a) Introduction. (1) Chemicals dissolved in natural waters are subject to two types of photoreaction. In the first case, the chemical of interest absorbs sunlight directly and is transformed to products when unstable excited states of the molecule decompose. In the second case, reaction of dissolved chemical is the result of chemical or electronic excitation transfer from light-absorbing humic species in the natural water. In contrast to direct photolysis, this photoreaction is governed initially by the spectroscopic properties of the natural water.
(2) In general, both indirect and direct processes can proceed simultaneously. Under favorable conditions the measurement of a photoreaction rate constant in sunlight (KpE) in a natural water body will yield a net value that is the sum of two first-order reaction rate constants for the direct (kDE) and indirect (kIE) pathways which can be expressed by the relationship
Equation 1 kpE = kDE + kIE. This relationship is obtained when the reaction volume is optically thin so that a negligible fraction of the incident light is absorbed and is sufficiently dilute in test chemical; thus the direct and indirect photoreaction processes become first-order.(3) In pure water only, direct photoreaction is possible, although hydrolysis, biotransformation, sorption, and volatilization also can decrease the concentration of a test chemical. By measuring kpE in a natural water and kDE in pure water, kIE can be calculated.
(4) Two protocols have been written that measure kDE in sunlight or predict kDE in sunlight from laboratory measurements with monochromatic light (USEPA (1984) under paragraph (f)(14) and (15) of this section; Mill et al. (1981) under paragraph (f)(9) of this section; Mill et al. (1982) under paragraph (f)(10) of this section; Mill et al. (1983) under paragraphs (f)(11) of this section). As a preface to the use of the present protocol, it is not necessary to know kDE; it will be determined under conditions that definitively establish whether kIE is significant with respect to kDE.
(5) This protocol provides a cost effective test method for measuring kIE for test chemicals in a natural water (synthetic humic water, SHW) derived from commercial humic material. It describes the preparation and standardization of SHW. To implement the method, a test chemical is exposed to sunlight in round tubes containing SHW and tubes containing pure water for defined periods of time based on a screening test.
(6) To correct for variations in solar irradiance during the reaction period, an actinometer is simultaneously insolated. From these data, an indirect photoreaction rate constant is calculated that is applicable to clear-sky, near-surface, conditions in fresh water bodies.
(7) In contrast to kDE, which, once measured, can be calculated for different seasons and latitudes, kIE only applies to the season and latitude for which it is determined. This condition exists because the solar action spectrum for indirect photoreaction in humic-containing waters is not generally known and would be expected to change for different test chemicals. For this reason, kpE, which contains kIE, is likewise valid only for the experimental data and latitude.
(8) The value of kpE represents an atypical quantity because kIE will change somewhat from water body to water body as the amount and quality of dissolved aquatic humic substances change. Studies have shown, however, that for optically-matched natural waters, these differences are usually within a factor of two (Zepp et al. (1981) under paragraph (f)(17) of this section).
(9) This protocol consists of three separate phases that should be completed in the following order: In Phase 1, SHW is prepared and adjusted; in Phase 2, the test chemical is irradiated in SHW and pure water (PW) to obtain approximate sunlight photoreaction rate constants and to determine whether direct and indirect photoprocesses are important; in Phase 3, the test chemical is again irradiated in PW and SHW. To correct for photobleaching of SHW and also solar irradiance variations, tubes containing SHW and actinometer solutions are exposed simultaneously. From these data kpE is calculated that is the sum of kIE and kDE (Equation 1) (Winterle and Mill (1985) under paragraph (f)(12) of this section).
(b) Phase 1—Preparation and standardization of synthetic natural water—(1) Approach. (i) Recent studies have demonstrated that natural waters can promote the indirect (or sensitized) photoreaction of dissolved organic chemicals. This reactivity is imparted by dissolved organic material (DOM) in the form of humic substances. These materials absorb sunlight and produce reactive intermediates that include singlet oxygen ( 102) (Zepp et al. (1977) under paragraph (f)(20) of this section, Zepp et al. (1981) under paragraph (f)(17) of this section, Zepp et al. (1981) under paragraph (f)(18) of this section, Wolff et al. (1981) under paragraph (f)(16) of this section, Haag et al. (1984) under paragraph (f)(6) of this section, Haag et al. (1984) under paragraph (f)(7) of this section); peroxy radicals (RO2−) (Mill et al. (1981) under paragraph (f)(9) of this section; Mill et al. (1983) under paragraph (f)(8) of this section); hydroxyl radicals (HO−) (Mill et al. (1981) under paragraph (f)(9) of this section, Draper and Crosby (1981, 1984) under paragraphs (f)(3) and (4) of this section); superoxide anion (02−−) and hydroperoxy radicals (HO−). (Cooper and Zika (1983) under paragraph (f)(1) of this section, Draper and Crosby (1983) under paragraph (f)(2) of this section); and triplet excited states of the humic substances (Zepp et al. (1981) under paragraph (f)(17) of this section, Zepp et al. (1985) under paragraph (f)(21) of this section). Synthetic humic waters, prepared by extracting commercial humic or fulvic materials with water, photoreact similarly to natural waters when optically matched (Zepp et al. (1981) under paragraphs (f)(17) and (18) of this section).
(ii) The indirect photoreactivity of a chemical in a natural water will depend on its response to these reactive intermediates, and possibly others yet unknown, as well as the ability of the water to generate such species. This latter feature will vary from water-to-water in an unpredictable way, judged by the complexity of the situation.
(iii) The approach to standardizing a test for indirect photoreactivity is to use a synthetic humic water (SHW) prepared by water-extracting commercial humic material. This material is inexpensive, and available to any laboratory, in contrast to a specific natural water. The SHW can be diluted to a dissolved organic carbon (DOC) content and uv-visible absorbance typical of most surface fresh waters.
(iv) In recent studies it has been found that the reactivity of SHW mixtures depends on pH, and also the history of sunlight exposure (Mill et al. (1983) under paragraph (f)(11) of this section). The SHW solutions initially photobleach with a time-dependent rate constant. As such, an SHW test system has been designed that is buffered to maintain pH and is pre-aged in sunlight to produce, subsequently, a predictable bleaching behavior.
(v) The purpose of Phase 1 is to prepare, pre-age, and dilute SHW to a standard mixture under defined, reproducible conditions.
(2) Procedure. (i) Twenty grams of Aldrich humic acid are added to a clean 2-liter Pyrex Erlenmeyer flask. The flask is filled with 2 liters of 0.1 percent NaOH solution. A stir bar is added to the flask, the flask is capped, and the solution is stirred for 1 hour at room temperature. At the end of this time the dark brown supernatant is decanted off and either filtered through coarse filter paper or centrifuged and then filtered through 0.4)m microfilter. The pH is adjusted to 7.0 with dilute H2SO4 and filter sterilized through a 0.2)m filter into a rigorously cleaned 2-liter Erlenmeyer flask. This mixture contains roughly 60 ppm DOC and the absorbance (in a 1 cm path length cell) is approximately 1.7 at 313 nm and 0.7 at 370 nm.
(ii) Pre-aging is accomplished by exposing the concentrated solution in the 2-liter flask to direct sunlight for 4 days in early spring or late fall; 3 days in late spring, summer, or early fall. At this time the absorbance of the solution is measured at 370 nm, and a dilution factor is calculated to decrease the absorbance to 0.50 in a 1 cm path length cell. If necessary, the pH is re-adjusted to 7.0. Finally, the mixture is brought to exact dilution with a precalculated volume of reagent-grade water to give a final absorbance of 0.500 in a 1-cm path length cell at 370 nm. It is tightly capped and refrigerated.
(iii) This mixture is SHW stock solution. Before use it is diluted 10-fold with 0.010 M phosphate buffer to produce a pH 7.0 mixture with an absorbance of 5.00 × 10⁻² at 370 nm, and a dissolved organic carbon of about 5 ppm. Such values are characteristic of many surface fresh waters.
(3) Rationale. The foregoing procedure is designed to produce a standard humic-containing solution that is pH controlled, and sufficiently aged that its photobleaching first-order rate constant is not time dependent. It has been demonstrated that after 7 days of winter sunlight exposure, SHW solutions photobleached with a nearly constant rate constant (Mill et al. (1983) under paragraph (f)(11) of this section).
(c) Phase 2—Screening test—(1) Introduction and purpose. (i) Phase 2 measurements provide approximate solar photolysis rate constants and half-lives of test chemicals in PW and SHW. If the photoreaction rate in SHW is significantly larger than in PW (factor of >2X) then the test chemical is subject to indirect photoreaction and Phase 3 is necessary. Phase 2 data are needed for more accurate Phase 3 measurements, which require parallel solar irradiation of actinometer and test chemical solutions. The actinometer composition is adjusted according to the results of Phase 2 for each chemical, to equalize as much as possible photoreaction rate constants of chemical in SHW and actinometer.
(ii) In Phase 2, sunlight photoreaction rate constants are measured in round tubes containing SHW and then mathematically corrected to a flat water surface geometry. These rate constants are not corrected to clear-sky conditions.
(2) Procedure. (i) Solutions of test chemicals should be prepared using sterile, air-saturated, 0.010 M, pH 7.0 phosphate buffer and reagent-grade (or purer) chemicals. 1 Reaction mixtures should be prepared with chemicals at concentrations at less than one-half their solubility in pure water and at concentrations such that, at any wavelengths above 290 nm, the absorbance in a standard quartz sample cell with a 1-cm path length is less than 0.05. If the chemicals are too insoluble in water to permit reasonable handling or analytical procedures, 1-volume percent acetonitrile may be added to the buffer as a cosolvent.
1 The water should be ASTM Type IIA, or an equivalent grade.
(ii) This solution should be mixed 9.00:1.00 by volume with PW or SHW stock solution to provide working solutions. In the case of SHW, it gives a ten-fold dilution of SHW stock solution. Six mL aliquots of each working solution should then be transferred to separate 12 × 100 mm quartz tubes with screw tops and tightly sealed with Mininert valves. 2 Twenty four tubes are required for each chemical solution (12 samples and 12 dark controls), to give a total of 48 tubes.
2 Mininert Teflon sampling vials are available from Alltech Associates, Inc., 202 Campus Dr., Arlington Heights, IL 60004.
(iii) The sample tubes are mounted in a photolysis rack with the tops facing geographically north and inclined 30° from the horizontal. The rack should be placed outdoors over a black background in a location free of shadows and excessive reflection.
(iv) Reaction progress should be measured with an analytical technique that provides a precision of at least ±5 percent. High pressure liquid chromatography (HPLC) or gas chromatograph (GC) have proven to be the most general and precise analytical techniques.
(v) Sample and control solution concentrations are calculated by averaging analytical measurements for each solution. Control solutions should be analyzed at least twice at zero time and at other times to determine whether any loss of chemical in controls or samples has occurred by some adventitious process during the experiment.
(vi) Whenever possible the following procedures should be completed in clear, warm, weather so that solutions will photolyze more quickly and not freeze.
(A) Starting at noon on day zero, expose to sunlight 24 sample tubes mounted on the rack described above. Tape 24 foil-wrapped controls to the bottom of the rack.
(B) Analyze two sample tubes and two unexposed controls in PW and SHW for chemical at 24 hours. Calculate the round tube photolysis rate constants (kp)SHW and (kp)W if the percent conversions are J 20 percent but F 80 percent. The rate constants (kp)SHW and (kp)W are calculated, respectively, from Equations 2 and 3:
Equation 2 (kp)SHW = (1/t)Pn(Co/Ct)SHW (in d−1) Equation 3 (kp)W = (1/t)Pn(Co/Ct)W (in d−1), where the subscript identifies a reaction in SHW or PW; t is the photolysis time in calendar days; Co is the initial molar concentration; and Ct is the molar concentration in the irradiated tube at t. In this case t = 1 day.(C) If less than 20 percent conversion occurs in SHW in 1 day, repeat the procedure for SHW and PW at 2 days, 4 days, 8 days, or 16 days, or until 20 percent conversion is reached. Do not extend the experiment past 16 days. If less than 20 percent photoreaction occurs in SHW at the end of 16 days the chemical is “photoinert”. Phase 3 is not applicable.
(D) If more than 80 percent photoreaction occurs at the end of day 1 in SHW, repeat the experiment with eight each of the remaining foil-wrapped PW and SHW controls. Divide these sets into four sample tubes each, leaving four foil-wrapped controls taped to the bottom of the rack.
(1) Expose tubes of chemical in SHW and PW to sunlight starting at 0900 hours and remove one tube and one control at 1, 2, 4, and 8 hours. Analyze all tubes the next day.
(2) Extimate (kp)SHW for the first tube in which photoreaction is J 20 percent but F 80 percent. If more than 80 percent conversion occurs in the first SHW tube, report: “The half-life is less than one hour” and end all testing. The chemical is “photolabile.” Phase 3 is not applicable.
(3) The rate constants (kp)SHW and (kp)W are calculated from equations 2 and 3 but the time of irradiation must be adjusted to reflect the fact that day-averaged rate constants are approximately one-third of rate constants averaged over only 8 daylight hours. For 1 hour of insolation enter t = 0.125 day into equation 2. For reaction times of 2, 4, and 8 hours enter 0.25, 0.50 and 1.0 days, respectively. Proceed to Phase 3 testing.
(4) Once (kp)SHW and (kp)W are measured, determine the ratio R from equation 4:
Equation 4 R = (kp)SHW/(kp)W. The coefficient R, defined by Equation 4, is equal to [(kI + kD)/kD]. If R is in the range 0 to 1, the photoreaction is inhibited by the synthetic humic water and Phase 3 does not apply. If R is in the range 1 to 2, the test chemical is marginally susceptable to indirect photolysis. In this case, Phase 3 studies are optional. If R is greater than 2, Phase 3 measurements are necessary to measure kpE and to evaluate kIE.(vii) Since the rate of photolysis in tubes is faster than the rate in natural water bodies, values of near-surface photolysis rate constants in natural and pure water bodies, kpE and kDE, respectively, can be obtained from (kp)SHW and (kp)W from Equations 5 and 6:
Equation 5 kpE = 0.45(kp)SHWEquation 6 kDE = 0.45(kp)W. The factor 0.45 is an approximate geometric correction for scattered light in tubes versus horizontal surfaces. A rough value of kIE, the rate constant for indirect photolysis in natural waters or SHW, can be estimated from the difference between kpE and kDE using Equation 7: Equation 7 kIE = kpE−kDE.(3) Criteria for Phase 2. (i) If no loss of chemical is found in dark control solutions compared with the analysis in tubes at zero time (within experimental error), any loss of chemical in sunlight is assumed to be due to photolysis, and the procedure provides a valid estimate of kpE and kDE. Any loss of chemical in the dark-control solutions may indicate the intervention of some other loss process such as hydrolysis, microbial degradation, or volatilization. In this case, more detailed experiments are needed to trace the problem and if possible eliminate or minimize the source of loss.
(ii) Rate constants determined by the Phase 2 protocol depend upon latitude, season, and weather conditions. Note that (kp)SHW and kD values apply to round tubes and kpE and kDE values apply to a natural water body. Because both (kp)SHW and kD are measured under the same conditions the ratio ((kp)SHW/kD) is a valid measure of the susceptibility of a chemical to indirect photolysis. However, since SHW is subject to photobleaching, (kp)SHW will decrease with time because the indirect rate will diminish. Therefore, R >2 is considered to be a conservative limit because (kp)SHW will become systematically smaller with time.
(4) Rationale. The Phase 2 protocol is a simple procedure for evaluating direct and indirect sunlight photolysis rate constants of a chemical at a specific time of year and latitude. It provides a rough rate constant for the chemical in SHW that is necessary for Phase 3 testing. By comparison with the direct photoreaction rate constant, it can be seen whether the chemical is subject to indirect photoreaction and whether Phase 3 tests are necessary.
(5) Scope and limitations. (i) Phase 2 testing separates test chemicals into three convenient categories: “Photolabile”, “photoinert”, and those chemicals having sunlight half-lives in round tubes in the range of 1 hour to 50 days. Chemicals in the first two categories fall outside the practical limits of the test, and cannot be used in Phase 3. All other chemicals are suitable for Phase 3 testing.
(ii) The test procedure is simple and inexpensive, but does require that the chemical dissolve in water at sufficient concentrations to be measured by some analytical technique but not have appreciable absorbance in the range 290 to 825 nm. Phase 2 tests should be done during a clear-sky period to obtain the best results. Testing will be less accurate for chemicals with half-lives of less than 1 day because dramatic fluctuations in sunlight intensity can arise from transient weather conditions and the difficulty of assigning equivalent reaction times. Normal diurnal variations also affect the photolysis rate constant. Phase 3 tests should be started as soon as possible after the Phase 2 tests to ensure that the (kp)SHW estimate remains valid.
(6) Illustrative Example. (i) Chemical A was dissolved in 0.010 M pH 7.0 buffer. The solution was filtered through a 0.2 )m filter, air saturated, and analyzed. It contained 1.7 × 10 −5 M A, five-fold less than its water solubility of 8.5 × 10 −5 M at 25 °C. A uv spectrum (1-cm path length) versus buffer blank showed no absorbance greater than 0.05 in the wavelength interval 290 to 825 nm, a condition required for the Phase 2 protocol. The 180 mL mixture was diluted by the addition of 20 mL of SHW stock solution.
(ii) The SHW solution of A was photolyzed in sealed quartz tubes (12 × 100 mm) in the fall season starting on October 1. At the end of 1 and 2 days, respectively, the concentration of A was found to be 1.13 × 10 −5 M and 0.92 × 10 −5 M compared to unchanged dark controls (1.53 × 10 −5 M).
(iii) The tube photolysis rate constant of chemical A was calculated from Equation 2 under paragraph (c)(2)(vi)(B) of this section. The first time point at day 1 was used because the fraction of A remaining was in the range 20 to 80 percent:
(kp)SHW = (1/1d)Pn(1.53 × 10 −5/1.13 × 10 −5) (kp)SHW = 0.30 d−1.(iv) From this value, kpE was found to be 0.14 d− 1 using equation 5 under paragraph (c)(2)(vii) of this section:
kpE = 0.45(0.30 d−1) = 0.14d−1.(v) From measurements in pure water, kD for chemical A was found to be 0.085 d−1. Because the ratio of (kp)SHW/kD( = 3.5) is greater than 2, Phase 3 experiments were started.
(d) Phase 3—Indirect photoreaction with actinometer: Calculation of kIEand kpE—(1) Introduction and purpose.
(i) The purpose of Phase 3 is to measure kIo, the indirect photolysis rate constant in tubes, and then to calculate kpE for the test chemical in a natural water. If the approximate (kp)SHW determined in Phase 2 is not significantly greater than kD measured for the experiment date of Phase 2, then Phase 3 is unnecessary because the test chemical is not subject to indirect photoreaction.
(ii) In the case (kp)SHW is significantly larger than kD, Phase 3 is necessary. The rate constant (kp)SHW is used to choose an actinometer composition that matches the actinometer rate to the test chemical rate. Test chemical solutions in SHW and in pure water buffer are then irradiated in sunlight in parallel with actinometer solutions, all in tubes.
(iii) The actinometer used is the p-nitroacetophenone-pyridine (PNAP/PYR) system developed by Dulin and Mill (1982) under paragraph (f)(5) of this section and is used in two EPA test guidelines (USEPA (1984) under paragraphs (f) (14) and (15) of this section). By varying the pyridine concentration, the PNAP photolysis half-life can be adjusted over a range of several hours to several weeks. The starting PNAP concentration is held constant.
(iv) SHW is subject to photobleaching that decreases its ability to promote indirect photolysis based on its ability to absorb sunlight. This effect will be significant when the test period exceeds a few days. To correct for photobleaching, tubes containing SHW are irradiated in action to the other tubes above.
(v) At any time, the loss of test chemical is given by Equation 8 assuming actinometric correction to constant light flux:
Equation 8 −(d[C]/dt) = kI[C] + kD[C].(vi) The indirect photolysis rate constant, kI, is actually time dependent because SHW photobleaches; the rate constant kI, after pre-aging, obeys the formula:
Equation 9 kI = kIo exp(−kt), in which kIo is the initial indirect photoreaction rate constant and k is the SHW photobleaching rate constant. After substituting equation 9 for kI in Equation 8 under paragraph (d)(1)(v) of this section, and rearranging, one obtains −(d[C]/[C] = kIo[exp(−kt)]dt + kD dt. This expression is integrated to give Equation 10: Equation 10 Pn(Co/C)SHW = (kIo/k)[1−exp(−kt)] + kD t. The term (kIo/k) can now be evaluated. Since in pure water, Pn(Co/C)W = kD t, then subtracting this equation from Equation 10 gives Equation 11 Pn(Co/C)SHW-Pn(co/C)W = (kIo/k)[1-exp(-kt)]. The photobleaching fraction, [1-exp(-kt)], is equivalent to the expression [1-(A370/A°370)], where A°370 and A370 are the absorbances at 370 nm, and are proportional to humic sensitizer content at times zero and t. Therefore, (kIo/k) is derived from the slope of a linear regression using [Pn(Co/C)SHW-Pn(Co/C)W] as the dependent variable and [1-(A370/A°370)SHW] as the independent variable.(vii) To evaluate kIo, the parameter k has to be evaluated under standard sunlight conditions. Therefore, the photolysis rate constant for the PNAP/PYR actinometer (kA) is used to evaluate k by linear regression on Equation 12:
Equation 12 Pn(A°370/A370) = (k/kA)Pn(Co/C)PNAP, where the slope is (k/kA) and the value of kA is calculated from the concentration of pyridine and the absorption of light by PNAP: kA = 2.2(0.0169)[PYR]ka. Values of ka are listed in the following Table 1.| Latitude | Season | |||
|---|---|---|---|---|
| Spring | Summer | Fall | Winter | |
| 20° N | 515 | 551 | 409 | 327 |
| 30° N | 483 | 551 | 333 | 232 |
| 40° N | 431 | 532 | 245 | 139 |
| 50° N | 362 | 496 | 154 | 6 |
| 1 ka = @ ega Lg in the units of day−1, (Mill et al. (1982) under paragraph (f)(10) of this section). | ||||
| 2 For use in Equation 15 under paragraph (d)(2)(i) of this section. |
(viii) To obtain kD, determine the ratio (kD/kA) from a linear regression of Pn(Co/C)W versus Pn(Co/C)PNAP according to Equation 13a:
Equation 13a Pn(Co/C)W = (kD/kA)Pn(Co/C)PNAP. The slope is (kD/kA), and kD is obtained by multiplication of this slope with the known value of kA: i.e., kD = (kD/kA)kA.(ix) Then, (kp)SHW values in SHW are determined by summing kD and KIo as follows:
Equation 14 (kp)SHW = kIo + kD.(x) Finally, kpE is calculated from the precise relationship, Equation 5a:
Equation 5a kpE = 0.455(kp)SHW.(2) Procedure. (i) Using the test chemical photoreaction rate constant in round tubes, (kp) SHW′ determined in Phase 2 under paragraph (c) of this section, and the absorption rate constant, kα found in Table 1, under paragraph (d)(1)(vii) of this section, calculate the molar pyridine concentration required by the PNAP/PYR actinometer using Equation 15:
Equation 15 [PYR]/M = 26.9[(kp) SHW/ka]. This pyridine concentration makes the actinometer rate constant match the test chemical rate constant.(A) The variable ka (= @ e ga Lg) is equal to the day-averaged rate constant for sunlight absorption by PNAP (USEPA (1984) under paragraph (f)(14) of this section; Mill et al. (1982) under paragraph (f)(10) of this section, Zepp and Cline (1977) under paragraph (f)(19) of this section) which changes with season and latitude.
(B) The variable ka is selected from Table 1 under paragraph (d)(1)(vii) of this section for the season nearest the mid-experiment date of Phase 2 studies and the decadic latitude nearest the experimental site.
(ii) Once [PYR] is determined, an actinometer solution is prepared by adding 1.00 mL of 1.0 × 10⁻² M (0.165 gms/100 mL) PNAP stock solution (in CH3 CN solvent) and the required volume, V, of PYR to a 1 liter volumetric flask. The flask is then filled with distilled water to give 1 liter of solution. The volume V can be calculated from Equation 16:
Equation 16 V/mL=[PYR]/0.0124. The PNAP/PYR solutions should be wrapped with aluminum foil and kept out of bright light after preparation.(iii) The following solutions should be prepared and individually added in 6.00 mL aliquots to 12/100 mm quartz sample tubes; 8 tubes should be filled with each solution:
(A) PNAP/PYR actinometer solution.
(B) Test chemical in pH 7.0, 0.010 M phosphate buffer.
(C) Test chemcial in pH 7.0, 0.010 M phosphate buffer/SHW.
(D) pH 7.0, 0.010 M phosphate buffer/SHW. Four tubes of each set are wrapped in foil and used as controls.
(iv) The tubes are placed in the photolysis rack (Phase 2, Procedure) at 0900 hours on day zero, with the controls taped to the bottom of the rack. One tube of each composition is removed, along with their respective controls, according to a schedule found in Table 2, which categorizes sampling times on the basis of (kp)SHW determined in Phase 1.
| Category | kp (d−1)SHW | Sampling procedure |
|---|---|---|
| A | 5.5 J Kp J 0.69 | Sample at 0, 1, 2, 4, and 8h. |
| B | 0.69>kp J 0.017 | Sample at 0, 1, 2, 4, and 8d. |
| C | 0.17>kp J 0.043 | Sample at 0, 4, 8, 16, and 32d. |
(v) The tubes containing PNAP, test chemical, and their controls are analyzed for residual concentrations soon after the end of the experiment. PNAP is conveniently analyzed by HPLC, using a 30 cm C18 reverse phase column and a uv detector set at 280 nm. The mobile phase is 2 percent acetic acid, 50 percent acetonitrile and 48 percent water (2 mL/min flow rate). Tubes containing only SHW (solution D) should be analyzed by absorption spectroscopy at 370 nm after storage at 4 °C in the dark. The absorbance range to be measured is 0.05 to 0.01 AU (1 cm).
(vi) If controls are well-behaved and show no significant loss of chemical or absorbance change, then kI can be calculated. In tabular form (see Table 4 under paragraph (d)(6)(iii)(A) of this section) arrange the quantities Pn(Co/Ct) SHW, Pn(Co/Ct)SHW, [1−(A370/A o370)], Pn(A o370/A370), and Pn(Co/C)PNAP in order of increasing time. According to Equation 11 under paragraph (d)(1)(vi) of this section in the form of Equation 17,
Equation 17 Pn(Co/C)SHW−Pn(Co/C)W = (kIo/k)[1−(A370/A o370)], plot the quantities [Pn(Co/Ct)SHW−Pn(Co/Ct)W] versus the independent variable [1−(A370/A o370)]. Obtain the slope (S1) by least square linear regression. Under the assumptions of the protocol, S1 = (kIo/k).(vii) According to Equation 12 under paragraph (d)(1)(vii) of this section, plot the quantities Pn(A o370/A370) versus the independent variable Pn(Co/Ct)PNAP. Obtain the slope (S2) by least squares linear regression on Equation 12 under paragraph (d)(1)(vii) of this section. Under the assumptions of the protocol, S2 = (k/kA).
(viii) Then, using Equation 13a under paragraph (d)(1)(vii) of this section, determine the slope (S3) by least squares linear regression. Under the assumptions of the protocol, S3 is equal to (kD/kA).
(ix) From Equation 18
Equation 18 kA = 0.0372[PYR]ka, calculate kA using ka values found in Table 1 under paragraph (d)(1)(vii) of this section. The value of ka chosen must correspond to the date closest to the mid-experiment date and latitude closest to that of the experimental site.(x) The indirect photoreaction rate constant, kIo, is determined using Equation 19,
Equation 19 kIo = (S1)(kA)(S2), by incorporating the quantities kA, S1, and S2 determined as described in paragraphs (d)(2) (ix), (vi), and (vii) of this section, respectively.(xi) The rate constant kD is calculated from Equation 20,
Equation 20 kD = (S3)(kA), using the quantities S3 and kA determined as described above.(xii) Then, (kp)SHW is obtained by summing kD and kIo, as described by Equation 14 in paragraph (d)(1)(ix) of this section:
Equation 14 (kp)SHW = kIo + kD.(xiii) Finally, kpE is obtained by multiplying (kp) SNW by the factor 0.455, as described by Equation 5a in paragraph (d)(1)(x) of this section:
Equation 5a kpE = 0.455 (kp)SHWAs determined, kpE is the net environmental photoreaction rate constant. It applies to clear sky conditions and is valid for predicting surface photoreaction rates in an average humic containing freshwater body. It is strictly valid only for the experimental latitude and season.(3) Criteria for Phase 3. As in Phase 2, Phase 3 tests are assumed valid if the dark controls are well behaved and show no significant loss of chemical. In such a case, loss of test chemical in irradiated samples is due to photoreaction.
(4) Rationale. Simultaneous irradiation of a test chemical and actinometer provide a means of evaluating sunlight intensities during the reaction period. Parallel irradiation of SHW solutions allows evaluation of the extent of photobleaching and loss of sensitizing ability of the natural water.
(5) Scope and limitations of Phase 3 protocol. Test chemicals that are classified as having half-lives in SHW in the range of 1 hour to 50 days in Phase 2 listing are suitable for use in Phase 3 testing. Such chemicals have photoreaction half-lives in a range accommodated by the PNAP/PYR actinometry in sunlight and also accommodate the persistence of SHW in sunlight.
(6) Illustrative example. (i) From Phase 2 testing, under paragraph (c)(6)(iii) of this section, chemical A was found to have a photolysis rate constant, (kp)SHW′ of 0.30 d−1 in fall in round tubes at latitude 33° N. Using Table 1 under paragraph (d)(1)(vii) of this section for 30° N, the nearest decadic latitude, a fall value of ka equal to 333 d−1 is found for PNAP. Substitution of (kp)SHW and ka into Equation 15 under paragraph (d)(2)(i) of this section gives [PYR] = 0.0242 M. This is the concentration of pyridine that gives an actinometer rate constant of 0.30 d−1 in round tubes in fall at this latitude.
(ii) The actinometer solution was made up by adding a volume of pyridine (1.95 mL) calculated from equation 16 under paragraph (d)(2)(ii) of this section to a 1 liter volumetric flask containing 1.00 mL of 1.00 × 10⁻² M PNAP in acetonitrile. The flask was filled to the mark with distilled water to give final concentrations of [PYR] = 0.0242 M and [PNAP] = 1.00 × 10⁻⁵ M. Ten tubes of each of the following solutions were placed in the photolysis rack at 1,200 hours on day zero:
(A) Chemical A (1.53 × 10⁻⁵ M) in standard SHW (0.010 M, pH 7 phosphate buffer).
(B) Chemical A (1.53 × 10⁻⁵), in 0.010 M, pH 7 phosphate buffer.
(C) SHW standard solution diluted with water 0.90 to 1.00 to match solution A.
(D) PNAP/PYR actinometer solution. Ten additional foil-wrapped controls of each mixture were taped to the bottom of the rack.
(iii) The test chemical had been placed in category B, Table 2 under the paragraph (d)(2)(iv) of this section, on the basis of its Phase 2 rate constant under paragraph (c) of this section. Accordingly, two tubes of each irradiated solution and two tubes of each blank solution were removed at 0, 1, 2, 4, and 8 days at 1,200 hours. The averaged analytical results obtained at the end of the experiment are shown in the following Table 3.
| Day | 105[C]SHW, M | 105[C]W, M | ASHW370 | 105 [PNAP], M |
|---|---|---|---|---|
| 0 | 1.53 | 1.53 | 0.0500 | 1.00 |
| 1 | 1.03 | 1.40 | 0.0470 | 0.810 |
| 2 | 0.760 | 1.30 | 0.0440 | 0.690 |
| 4 | 0.300 | 1.01 | 0.0370 | 0.380 |
| 8 | 0.130 | 0.800 | 0.0320 | 0.220 |
(A) From these items the functions Pn(Co/C) SNW′ Pn(Co/C)W′ [1—(A370/A o370)SNW], Pn(A o370/A370), and Pn(Co/C)PNAP were calculated, as shown in the following Table 4 which was derived from Table 3 under paragraph (d)(6)(iii) of this section:
| Day | Pn(Co/C)SHW | Pn(Co/C)W | 1-(A 370 /Ao370) | Pn(Ao370 /A370) | Pn(Co /C) PNAP |
|---|---|---|---|---|---|
| 0 | 0 | 0 | 0 | 0 | 0 |
| 1 | 0.396 | 0.0888 | 0.0600 | 0.0618 | 0.211 |
| 2 | 0.700 | 0.163 | 0.120 | 0.128 | 0.371 |
| 4 | 1.629 | 0.415 | 0.260 | 0.301 | 0.968 |
| 8 | 2.465 | 0.648 | 0.360 | 0.446 | 1.514 |
(B) Slope S1 = (kIo/k) was calculated according to Equation 17 under paragraph (d)(2)(vi) of this section and was found to be 4.96 by a least squares regression with a correlation coefficient equal to 0.9980. The following Figure 1 shows a plot of Equation 17 under paragraph (d)(2)(vi) of this section and its best-fit line.
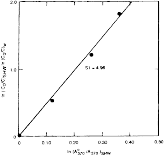 Figure 1—Graphic determination of S1 = (kIo/k) based on Equation 17 under paragraph (d)(2)(vi) of this section.
(C) Slope S2 = (k/ka) was also derived from Table 4 under paragraph (d)(6)(iii)(A) of this section by a fit of Pn(A o370 /A370) SHW and Pn(Co /C)PNAP to Equation 12 under paragraph (d)(l)(vii) of this section. This plot is displayed in the following Figure 2; the slope S2 was found to be 0.295 and the correlation coefficient was equal to 0.9986.
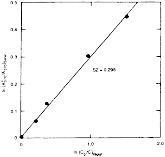 Figure 2—Graphic determination of S2 = (k/kA) based on Equation 12 under paragraph (d)(1)(vii) of this section.
(D) Using the data in columns 3 and 6 in Table 4 under paragraph (d)(6)(iii)(A) of this section, slope S3 was calculated by regression from Equation 13a under paragraph (d)(1)(viii) of this section and was found to be 0.428 with correlation coefficient equal to 0.99997.
(E) Using Equation 18 under paragraph (d)(2)(ix) of this section, kA was found to be = 0.300d−1.
(F) The values of S1, S2, and kA were then combined in Equation 19 under paragraph (d)(2)(x) of this section to give kIo as follows:
Equation 19 kIo = (4.96)(0.300)(0.295) = 0.439d−1.(G) The rate constant kD was calculated from the product of S3 and kA as expressed in Equation 20 under paragraph (d)(2)(xi) of this section as follows:
Equation 20 kD = (0.428)(0.300) = 0.128d−1.(H) The sum of kD and kIo was multiplied by 0.455 to obtain kpE as follows:
Equation 21 kpE = (0.455)(0.439 + 0.128)d−1 = 0.258 d−1.(I) Since kpE is a first-order rate constant, the half-life, t1/2E, is given by Equation 22:
Equation 22 t1/2E = 0.693/kpE. Substituting the value of kpE from Equation 21 under paragraph (d)(6)(iii)(H) of this section in Equation 22 yielded Equation 23 t1/2E = 0.693/0.258d−1 = 2.7 d.(e) Data and reporting—(1) Test conditions—(i) Specific analytical and recovery procedures. (A) Provide a detailed description or reference for the analytical procedures used, including the calibration data and precision.
(B) If extraction methods were used to separate the solute from the aqueous solution, provide a description of the extraction method as well as the recovery data.
(ii) Other test conditions. (A) Report the site and latitude where the photolysis experiments were carried out.
(B) Report the dates of photolysis, weather conditions, times of exposure, and the duration of exposure.
(C) If acetonitrile was used to solubilize the test chemical, report the volume percent.
(D) If a significant loss of test chemical occurred in the control solutions for pure water and SHW, indicate the causes and how they were eliminated or minimized.
(2) Test data report—(i) Phase 2 Screening Test under paragraph (c) of this section. (A) Report the initial molar concentration of test chemical, Co, in pure water and SHW for each replicate and the mean value.
(B) Report the molar concentration of test chemical, Ct, in pure water and SHW for each replicate and the mean value for each time point t.
(C) Report the molar concentration of test chemical for each replicate control sample and the mean value for each time point.
(D) Report the values of (kp)SHW and (kp)W for the time point t in which the fraction of test chemical photoreacted is in the range 20 to 80 percent.
(E) If small losses of test chemical were observed in SHW and pure water, report a first-order rate constant loss, (kp)loss. Calculate and report (kp)obs for SHW and/or pure water. Calculate and report the corrected first-order rate constant for SHW and/or pure water using the relationship expressed in Equation 24:
Equation 24 kp = (kp)obs−(kp)loss.(F) Report the value of R calculated from Equation 4 under paragraph (c)(2)(vi)(D)(4) of this section.
(G) Report the values of kpE and kDE obtained from Equations 5 and 6, respectively under paragraph (c)(2)(vii) of this section; report the corresponding half-life calculated from Equation 22 under paragraph (d)(6)(iii)(I) of this section.
(ii) Phase 3—Indirect photoreaction with actinometer. (A) Report the initial molar concentration of test chemical, Co, in pure water and in SHW for each replicate and the mean value.
(B) Report the initial absorbance A o370 of the SNW solution.
(C) Report the initial molar concentration of PNAP of each replicate and the mean value in the actinometer. Report the concentration of pyridine used in the actinometer which was obtained from Equation 15 under paragraph (d)(2)(i) of this section.
(D) Report the time and date the photolysis experiments were started, the time and date the experiments were completed, and the elapsed photolysis time in days.
(E) For each time point t, report the separate values of the absorbance of the SHW solution, and the mean values.
(F) For each time point for the controls, report the separate values of the molar concentrations of test chemical in pure water and SHW, and the absorbance of the SHW solution, and the mean values.
(G) Tabulate and report the following data: t, [C] SHW, [C] W, A SNW370, [PNAP].
(H) From the data in (G), tabulate and report the following data: t, Pn(Co/C)SNW, Pn(Co/C)W, [1−(A370/A o370)SNW], Pn(A o370/A370), Pn(Co/C)PNAP.
(I) From the linear regression analysis of the appropriate data in step (H) in Equation 17 under paragraph (d)(2)(vi) of this section, report the slope S1 and the correlation coefficient.
(J) From the linear regression analysis of the appropriate data in step (H) in Equation 12 under paragraph (d)(1)(vii) of this section, report the slope S2 and the correlation coefficient.
(K) From the linear regression analysis of the appropriate data in step (H) in Equation 13a under paragraph (d)(1)(viii) of this section, report the slope S3 and the correlation coefficient.
(L) If loss of chemical was observed during photolysis in pure water and SHW, then report the data Pn(Co/C)corr, Pn(Co/C)obs, Pn(Co/C)loss as described in paragraph (e)(2)(E) of this section. Repeat steps (H), (I), (J), (K) where applicable and report S1, S2, S3 and the corresponding correlation coefficients.
(M) Report the value of the actinometer rate constant obtained from Equation 18 under paragraph (d)(2)(ix) of this section.
(N) Report the value of kIo obtained from Equation 19 under paragraph (d)(2)(x) of this section.
(O) Report the value of kD obtained from Equation 20 under paragraph (d)(2)(xi) of this section.
(P) Report the value of (kpE)SHW, obtained from Equation 14 under paragraph (d)(1)(ix) of this section, and the value of kpE obtained from Equation 5a under paragraph (d)(1)(x) of this section.
(Q) Report the half-life, t1/2E, obtained from Equation 22 under paragraph (d)(6)(iii)(I) of this section.
(f) References. For additional background information on this test guideline the following references should be consulted.
(1) Cooper W.J., Zika R.G. “Photochemical formation of hydrogen peroxide in surface and ground waters exposed to sunlight.” Science, 220:711. (1983).
(2) Draper W.M., Crosby D.G. “The photochemical generation of hydrogen peroxide in natural waters.” Archives of Environmental Contamination and Toxicology, 12:121. (1983).
(3) Draper, W.M. and Crosby D.G. “Solar photooxidation of pesticides in dilute hydrogen peroxide.” Journal of Agricultural and Food Chemistry, 32:231. (1984).
(4) Draper W.M., Crosby D.G. “Hydrogen peroxide and hydroxyl radical: Intermediates in indirect photolysis reactions in water.” Journal of Agricultural and Food Chemistry, 29:699. (1981).
(5) Dulin D., Mill T. “Development and evaluation of sunlight actinometers.” Environmental Science and Technology, 6:815. (1982).
(6) Haag H.R., Hoigne J., Gassman E., Braun A.M. “Singlet oxygen in surface waters—Part I; Furfuryl alcohol as a trapping agent.” Chemosphere, 13:631. (1984).
(7) Haag W.R., Hoigne J., Gassman E., Braun A.M. “Singlet oxygen in surface waters—Part II: Quantum yields of its production by some natural humic materials as a function of wavelength.” Chemosphere, 13:641. (1984).
(8) Mill T., Winterle J.S., Fischer A., Tse D., Mabey W.R., Drossman H., Liu A., Davenport J.E. Toxic substances process data generation and protocol development. Work assignment 12, test standard development. “Section 3. Indirect photolysis.” Draft final report. EPA Contract No. 68-03-2981. Environmental Research Laboratory, Office of Research and Development, EPA, Athens, GA, and Office of Pollution Prevention and Toxics, EPA, Washington, DC. (1984).
(9) Mill T., Mabey W.R., Bomberger D.C., Chou T.W., Hendry D.G., Smith J.H. “Laboratory protocols for evaluating the fate of organic chemicals in air and water. Chapter 3. Photolysis in water. Chapter 4. Oxidation in water.” EPA 600/3-82-022. Environmental Research Laboratory, Office of Research and Development, EPA, Athens, GA. (1981).
(10) Mill T., Mabey W.R., Winterle J.S., Davenport J.E., Barich V.P., Dulin D.E., Tse D.S., Lee G. “Design and validation of screening and detailed methods for environmental processes. Appendix C. Lower-tier direct photolysis protocol.” Draft final report. EPA Contract No. 68-01-6325. Office of Pollution Prevention and Toxics, EPA, Washington, DC. (1982).
(11) Mill T., Davenport J.E., Winterle J.S., Mabey W.R., Dossman H., Tse D., Liu A. Toxic substances process data generation and protocol development. Work assignment 12. “Appendix B. Upper-tier protocol for direct photolysis in water.” Draft final report. EPA Contract No. 68-03-2981. Environmental Research Laboratory, Office of Research and Development, EPA, Athens, GA, and Office of Pollution Prevention and Toxics, EPA, Washington, DC. (July 1983).
(12) Winterle J.S., Mill T. Toxic substances process data generation and protocol development. Work assignment 18. “Indirect photoreaction protocol.” Draft EPA special report. EPA Contract No. 68-03-2981. Environmental Research Laboratory, Office of Research and Development, EPA, Athens, GA and Office of Pollution Prevention and Toxics, EPA, Washington, DC. (1985).
(13) Mill T., Hendry D.G., Richardson H. “Free radical oxidants in natural waters.” Science, 207:886. (1980).
(14) U.S. Environmental Protection Agency (USEPA), Office of Pollution Prevention and Toxics (OPPT). “Chemical fate test guidelines. Test guideline (CG, CS-6000). Photolysis in aqueous solution.” EPA-560/6-84-003. NTIS publication PB-84-233287. (1984).
(15) USEPA, OPPT. “Chemical fate test guidelines. Test guildeline (CG, CS-6010). Laboratory determination of the direct photolysis reaction quantum yield in aqueous solution and sunlight photolysis.” EPA-560/6-84-003. NTIS publication PB-84-233287. (1984).
(16) Wolff C.J.M., Halmans M.T.H., Van der Heijde H.B. “The formation of singlet oxygen in surface waters.” Chemosphere, 10:59. (1981).
(17) Zepp R.G., Baughman G.L., Schlotzhauer P.F. “Comparison of photochemical behavior of various humic substances in water: I. Sunlight induced reactions of aquatic pollutants photosensitized by humic substances.” Chemosphere, 10:109. (1981).
(18) Zepp R.G., Baughman G.L., Schlozhauer P.F. “Comparison of photochemical behavior of various humic substances in water: II. Photosensitized oxygenations.” Chemosphere, 10:119. (1981).
(19) Zepp R.G., Cline D.M. “Rates of direct photolysis in aquatic environments.” Environmental Science and Technology, 11:359. (1977).
(20) Zepp, R.G., Wolfe N.L., Baughman G.L., Hollis R.C. “Singlet oxygen in natural waters.” Nature, 267:421. (1977).
(21) Zepp R.G., Schlotzhauer P.F., Merritt S.R. “Photosensitized transformations involving electronic energy transfer in natural waters: role of humic substances.” Environmental Science and Technology, 19:74. (1985).
[53 FR 34522, Sept. 7, 1988; 53 FR 37393, Sept. 26, 1988]