Appendix IX to Part 86 - Experimentally Determining the R-Factor for Bench Aging Durability Procedures
40:21.0.1.1.5.21.1.12.67 : Appendix IX
Appendix IX to Part 86 - Experimentally Determining the R-Factor
for Bench Aging Durability Procedures
The R-Factor is the catalyst thermal reactivity coefficient used
in the bench aging time (BAT) equation [Ref. § 86.1826-08(d)(3)].
Manufacturers may determine the value of R experimentally using the
following procedures.
1. Using the applicable bench cycle and aging bench hardware,
age several catalysts (minimum of 3 of the same catalyst design) at
different control temperatures between the normal operating
temperature and the damage limit temperature. Measure emissions (or
catalyst inefficiency (1-catalyst efficiency)) for each
constituent. Assure that the final testing yields data between one-
and two-times the standard.
2. Estimate the value of R and calculate the effective reference
temperature (Tr) for the bench aging cycle for each control
temperature according to the procedure described in §
86.1826-08(d)(4).
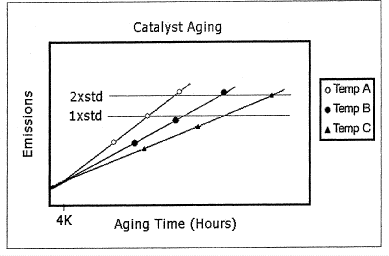
3. Plot emissions (or catalyst inefficiency) versus aging time
for each catalyst. Calculate the least-squared best-fit line
through the data. For the data set to be useful for this purpose
the data should have an approximately common intercept between 0
and 4000 miles. See the following graph for an example.
4. Calculate the slope of the best-fit line for each aging
temperature.
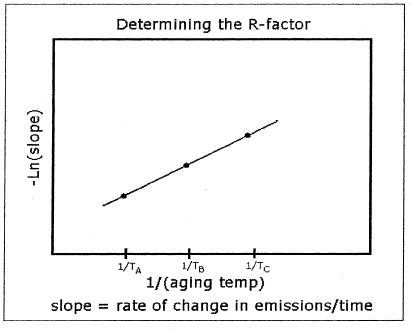
5. Plot the natural log (ln) of the slope of each best-fit line
(determined in step 4) along the vertical axis, versus the inverse
of aging temperature (1/(aging temperature, deg K)) along the
horizontal axis, Calculate the least-squared best-fit lines through
the data. The slope of the line is the R-factor. See the following
graph for an example.

6. Compare the R-factor to the initial value that was used in
Step 2. If the calculated R-factor differs from the initial value
by more than 5%, choose a new R-factor that is between the initial
and calculated values, then repeat Steps 2-6 to derive a new
R-factor. Repeat this process until the calculated R-factor is
within 5% of the initially assumed R-factor.
7. Compare the R-factor determined separately for each
constituent. Use the lowest R-factor (worst case) for the BAT
equation.

[71 FR
2837, Jan. 17, 2006]