Title 40
PART 53 APPENDIX
| Pollutant | Reference or equivalent |
Manual or automated | Applicable part 50 appendix | Applicable subparts of part 53 | |||||
|---|---|---|---|---|---|---|---|---|---|
| A | B | C | D | E | F | ||||
| SO2 | Reference | Manual | A-2 | ||||||
| Automated | A-1 | ✓ | ✓ | ||||||
| Equivalent | Manual | A-1 | ✓ | ✓ | |||||
| Automated | A-1 | ✓ | ✓ | ✓ | |||||
| CO | Reference | Automated | C | ✓ | ✓ | ||||
| Equivalent | Manual | C | ✓ | ✓ | |||||
| Automated | C | ✓ | ✓ | ✓ | |||||
| O3 | Reference | Automated | D | ✓ | ✓ | ||||
| Equivalent | Manual | D | ✓ | ✓ | |||||
| Automated | D | ✓ | ✓ | ✓ | |||||
| NO2 | Reference | Automated | F | ✓ | ✓ | ||||
| Equivalent | Manual | F | ✓ | ✓ | |||||
| Automated | F | ✓ | ✓ | ✓ | |||||
| Pb | Reference | Manual | G | ||||||
| Equivalent | Manual | G | ✓ | ✓ | |||||
| Automated | G | ✓ | ✓ | ||||||
| PM 10-Pb | Reference | Manual | Q | ||||||
| Equivalent | Manual | Q | ✓ | ✓ | |||||
| Automated | Q | ✓ | ✓ | ||||||
| PM 10 | Reference | Manual | J | ✓ | ✓ | ||||
| Equivalent | Manual | J | ✓ | ✓ | ✓ | ||||
| Automated | J | ✓ | ✓ | ✓ | |||||
| PM 2.5 | Reference | Manual | L | ✓ | ✓ | ||||
| Equivalent Class I | Manual | L | ✓ | ✓ | ✓ | ||||
| Equivalent Class II | Manual | L 1 | ✓ | ✓ 2 | ✓ | ✓ 1 2 | |||
| Equivalent Class III | Automated | L 1 | ✓ | ✓ | ✓ | ✓ 1 | |||
| PM 10-2.5 | Reference | Manual | L, O | ✓ | ✓ | ||||
| Equivalent Class I | Manual | L, O | ✓ | ✓ | ✓ | ||||
| Equivalent Class II | Manual | L, O | ✓ | ✓ 2 | ✓ | ✓ 1 2 | |||
| Equivalent Class III | Automated | L 1, O 1 | ✓ | ✓ | ✓ | ✓ 1 | |||
1. Some requirements may apply, based on the nature of each particular candidate method, as determined by the Administrator.
2. Alternative Class III requirements may be substituted.
Appendix A to Subpart A of Part 53 - References
40:6.0.1.1.1.1.1.17.2 : Appendix A
Appendix A to Subpart A of Part 53 - References(1) American National Standard Quality Systems - Model for Quality Assurance in Design, Development, Production, Installation, and Servicing, ANSI/ISO/ASQC Q9001-1994. Available from American Society for Quality, P.O. Box 3005, Milwaukee, WI 53202 (http://qualitypress.asq.org).
(2) American National Standard Quality Systems for Environmental Data and Technology Programs - Requirements with guidance for use, ANSI/ASQC E4-2004. Available from American Society for Quality P.O. Box 3005, Milwaukee, WI 53202 (http://qualitypress.asq.org).
(3) Dimensioning and Tolerancing, ASME Y14.5M-1994. Available from the American Society of Mechanical Engineers, 345 East 47th Street, New York, NY 10017.
(4) Mathematical Definition of Dimensioning and Tolerancing Principles, ASME Y14.5.1M-1994. Available from the American Society of Mechanical Engineers, 345 East 47th Street, New York, NY 10017.
(5) ISO 10012, Quality Assurance Requirements for Measuring Equipment-Part 1: Meteorological confirmation system for measuring equipment):1992(E). Available from American Society for Quality Control, 611 East Wisconsin Avenue, Milwaukee, WI 53202.
(6) Quality Assurance Guidance Document 2.12. Monitoring PM 2.5 in Ambient Air Using Designated Reference or Class I Equivalent Methods. U.S. EPA, National Exposure Research Laboratory, Research Triangle Park, NC, November 1998 or later edition. Currently available at http://www.epa.gov/ttn/amtic/pmqainf.html.
[62 FR 38784, July 18, 1997, as amended at 71 FR 61278, Oct. 17, 2006]Figure B-1 to Subpart B of Part 53 - Example
40:6.0.1.1.1.2.1.5.3 :
Figure B-1 to Subpart B of Part 53 - Example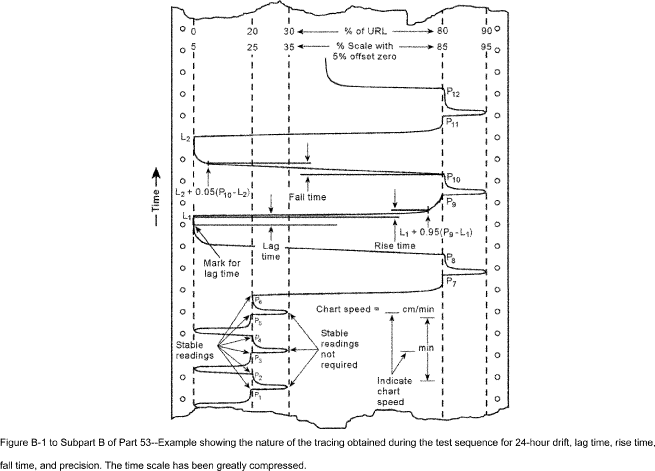
Table B-1 to Subpart B of Part 53 - Performance Limit Specifications for Automated Methods
40:6.0.1.1.1.2.1.5.4 :
Table B-1 to Subpart B of Part 53 - Performance Limit Specifications for Automated Methods| Performance parameter |
Units 1 | SO2 | O3 | CO | NO2 (Std. range) |
Definitions and
test procedures |
|||
|---|---|---|---|---|---|---|---|---|---|
| Std. range 3 | Lower range 2 3 | Std. range 3 | Lower range 2 3 | Std. range 3 | Lower range 2 3 | ||||
| 1. Range | ppm | 0-0.5 | <0.5 | 0-0.5 | <0.5 | 0-50 | <50 | 0-0.5 | Sec. 53.23(a) |
| 2. Noise | ppm | 0.001 | 0.0005 | 0.0025 | 0.001 | 0.2 | 0.1 | 0.005 | Sec. 53.23(b) |
| 3. Lower detectable limit | ppm | 0.002 | 0.001 | 0.005 | 0.002 | 0.4 | 0.2 | 0.010 | Sec. 53.23(c) |
| 4. Interference equivalent | |||||||||
| Each interferent | ppm | ±0.005 | 4 ±0.005 | ±0.005 | ±0.005 | ±1.0 | ±0.5 | ±0.02 | Sec. 53.23(d) |
| Total, all interferents | ppm | - | - | - | - | - | - | 0.04 | Sec. 53.23(d) |
| 5. Zero drift, 12 and 24 hour | ppm | ±0.004 | ±0.002 | ±0.004 | ±0.002 | ±0.5 | ±0.3 | ±0.02 | Sec. 53.23(e) |
| 6. Span drift, 24 hour | |||||||||
| 20% of upper range limit | Percent | - | - | - | - | - | - | ±20.0 | Sec. 53.23(e) |
| 80% of upper range limit | Percent | ±3.0 | ±3.0 | ±3.0 | ±3.0 | ±2.0 | ±2.0 | ±5.0 | Sec. 53.23(e) |
| 7. Lag time | Minutes | 2 | 2 | 2 | 2 | 2.0 | 2.0 | 20 | Sec. 53.23(e) |
| 8. Rise time | Minutes | 2 | 2 | 2 | 2 | 2.0 | 2.0 | 15 | Sec. 53.23(e) |
| 9. Fall time | Minutes | 2 | 2 | 2 | 2 | 2.0 | 2.0 | 15 | Sec. 53.23(e) |
| 10. Precision | |||||||||
| 20% of upper range limit | - | - | - | - | - | - | Sec. 53.23(e) | ||
| Percent 5 | 2 | 2 | 2 | 2 | 1.0 | 1.0 | 4 | Sec. 53.23(e) | |
| 80% of upper range limit | - | - | - | - | - | - | Sec. 53.23(e) | ||
| Percent 5 | 2 | 2 | 2 | 2 | 1.0 | 1.0 | 6 | Sec. 53.23(e) Sec. 53.23(e) |
|
1 To convert from parts per million (ppm) to µg/m 3 at 25 °C and 760 mm Hg, multiply by M/0.02447, where M is the molecular weight of the gas. Percent means percent of the upper measurement range limit.
2 Tests for interference equivalent and lag time do not need to be repeated for any lower range provided the test for the standard range shows that the lower range specification (if applicable) is met for each of these test parameters.
3 For candidate analyzers having automatic or adaptive time constants or smoothing filters, describe their functional nature, and describe and conduct suitable tests to demonstrate their function aspects and verify that performances for calibration, noise, lag, rise, fall times, and precision are within specifications under all applicable conditions. For candidate analyzers with operator-selectable time constants or smoothing filters, conduct calibration, noise, lag, rise, fall times, and precision tests at the highest and lowest settings that are to be included in the FRM or FEM designation.
4 For nitric oxide interference for the SO2 UVF method, interference equivalent is ±0.0003 ppm for the lower range.
5 Standard deviation expressed as percent of the URL.
Table B-2 to Subpart B of Part 53 - Test Atmospheres
40:6.0.1.1.1.2.1.5.5 :
Table B-2 to Subpart B of Part 53 - Test Atmospheres| Test gas | Generation | Verification |
|---|---|---|
| Ammonia | Permeation device. Similar to system described in references 1 and 2 | Indophenol method, reference 3. |
| Carbon dioxide | Cylinder of zero air or nitrogen containing CO2 as required to obtain the concentration specified in table B-3 | Use NIST-certified standards whenever possible. If NIST standards are not available, obtain 2 standards from independent sources which agree within 2 percent, or obtain one standard and submit it to an independent laboratory for analysis, which must agree within 2 percent of the supplier's nominal analysis. |
| Carbon monoxide | Cylinder of zero air or nitrogen containing CO as required to obtain the concentration specified in table B-3 | Use an FRM CO analyzer as described in reference 8. |
| Ethane | Cylinder of zero air or nitrogen containing ethane as required to obtain the concentration specified in table B-3 | Gas chromatography, ASTM D2820, reference 10. Use NIST-traceable gaseous methane or propane standards for calibration. |
| Ethylene | Cylinder of pre-purified nitrogen containing ethylene as required to obtain the concentration specified in table B-3 | Do. |
| Hydrogen chloride | Cylinder 1 of pre-purified nitrogen containing approximately 100 ppm of gaseous HCl. Dilute with zero air to concentration specified in table B-3 | Collect samples in bubbler containing distilled water and analyze by the mercuric thiocyanate method, ASTM (D612), p. 29, reference 4. |
| Hydrogen sulfide | Permeation device system described in references 1 and 2 | Tentative method of analysis for H2S content of the atmosphere, p. 426, reference 5. |
| Methane | Cylinder of zero air containing methane as required to obtain the concentration specified in table B-3 | Gas chromatography ASTM D2820, reference 10. Use NIST-traceable methane standards for calibration. |
| Nitric oxide | Cylinder 1 of pre-purified nitrogen containing approximately 100 ppm NO. Dilute with zero air to required concentration | Gas phase titration as described in reference 6, section 7.1. |
| Nitrogen dioxide | 1. Gas phase titration as
described in reference 6 2. Permeation device, similar to system described in reference 6 |
1. Use an FRM NO2 analyzer
calibrated with a gravimetrically calibrated permeation device. 2. Use an FRM NO2 analyzer calibrated by gas-phase titration as described in reference 6. |
| Ozone | Calibrated ozone generator as described in reference 9 | Use an FEM ozone analyzer calibrated as described in reference 9. |
| Sulfur dioxide | 1. Permeation device as
described in references 1 and 2 2. Dynamic dilution of a cylinder containing approximately 100 ppm SO2 as described in Reference 7 |
Use an SO2 FRM or FEM analyzer as described in reference 7. |
| Water | Pass zero air through distilled water at a fixed known temperature between 20° and 30 °C such that the air stream becomes saturated. Dilute with zero air to concentration specified in table B-3 | Measure relative humidity by means of a dew-point indicator, calibrated electrolytic or piezo electric hygrometer, or wet/dry bulb thermometer. |
| Xylene | Cylinder of pre-purified nitrogen containing 100 ppm xylene. Dilute with zero air to concentration specified in table B-3 | Use NIST-certified standards whenever possible. If NIST standards are not available, obtain 2 standards from independent sources which agree within 2 percent, or obtain one standard and submit it to an independent laboratory for analysis, which must agree within 2 percent of the supplier's nominal analysis. |
| Zero air | 1. Ambient air purified by
appropriate scrubbers or other devices such that it is free of
contaminants likely to cause a detectable response on the
analyzer 2. Cylinder of compressed zero air certified by the supplier or an independent laboratory to be free of contaminants likely to cause a detectable response on the analyzer |
1 Use stainless steel pressure regulator dedicated to the pollutant measured.
Reference 1. O'Keefe, A. E., and Ortaman, G. C. “Primary Standards for Trace Gas Analysis,” Anal. Chem. 38, 760 (1966).
Reference 2. Scaringelli, F. P., A. E. . Rosenberg, E*, and Bell, J. P., “Primary Standards for Trace Gas Analysis.” Anal. Chem. 42, 871 (1970).
Reference 3. “Tentative Method of Analysis for Ammonia in the Atmosphere (Indophenol Method)”, Health Lab Sciences, vol. 10, No. 2, 115-118, April 1973.
Reference 4. 1973 Annual Book of ASTM Standards, American Society for Testing and Materials, 1916 Race St., Philadelphia, PA.
Reference 5. Methods for Air Sampling and Analysis, Intersociety Committee, 1972, American Public Health Association, 1015.
Reference 6. 40 CFR 50 Appendix F, “Measurement Principle and Calibration Principle for the Measurement of Nitrogen Dioxide in the Atmosphere (Gas Phase Chemiluminescence).”
Reference 7. 40 CFR 50 Appendix A-1, “Measurement Principle and Calibration Procedure for the Measurement of Sulfur Dioxide in the Atmosphere (Ultraviolet FIuorscence).”
Reference 8. 40 CFR 50 Appendix C, “Measurement Principle and Calibration Procedure for the Measurement of Carbon Monoxide in the Atmosphere (Non-Dispersive Infrared Photometry)”.
Reference 9. 40 CFR 50 Appendix D, “Measurement Principle and Calibration Procedure for the Measurement of Ozone in the Atmosphere”.
Reference 10. “Standard Test Method for C, through C5 Hydrocarbons in the Atmosphere by Gas Chromatography”, D 2820, 1987 Annual Book of Aston Standards, vol 11.03, American Society for Testing and Materials, 1916 Race St., Philadelphia, PA 19103.
Table B-3 to Subpart B of Part 53 - Interferent Test Concentration, 1 Parts per Million
40:6.0.1.1.1.2.1.5.6 :
Table B-3 to Subpart B of Part 53 - Interferent Test Concentration, 1 Parts per Million| Pollutant | Analyzer type | Hydro-chloric acid | Ammonia | Hydrogen sulfide |
Sulfur dioxide | Nitrogen dioxide | Nitric oxide | Carbon dioxide | Ethylene | Ozone | Mxy- lene |
Water vapor | Carbon monoxide | Methane | Ethane | Naphthalene |
|---|---|---|---|---|---|---|---|---|---|---|---|---|---|---|---|---|
| SO2 | Ultraviolet fluorescence | 5 0.1 | 4 0.14 | 0.5 | 0.5 | 0.5 | 0.2 | 20,000 | 6 0.05 | |||||||
| SO2 | Flame photometric | 0.01 | 4 0.14 | 750 | 3 20,000 | 50 | ||||||||||
| SO2 | Gas chromatography | 0.1 | 4 0.14 | 750 | 3 20,000 | 50 | ||||||||||
| SO2 | Spectrophotometric-wet chemical (pararosanaline) | 0.2 | 0.1 | 0.1 | 4 0.14 | 0.5 | 750 | 0.5 | ||||||||
| SO2 | Electrochemical | 0.2 | 0.1 | 0.1 | 4 0.14 | 0.5 | 0.5 | 0.2 | 0.5 | 3 20,000 | ||||||
| SO2 | Conductivity | 0.2 | 0.1 | 4 0.14 | 0.5 | 750 | ||||||||||
| SO2 | Spectrophotometric-gas phase, including DOAS | 4 0.14 | 0.5 | 0.5 | 0.2 | |||||||||||
| O3 | Chemiluminescent | 3 0.1 | 750 | 4 0.08 | 3 20,000 | |||||||||||
| O3 | Electrochemical | 3 0.1 | 0.5 | 0.5 | 4 0.08 | |||||||||||
| O3 | Spectrophotometric-wet chemical (potassium iodide) | 3 0.1 | 0.5 | 0.5 | 3 0.5 | 4 0.08 | ||||||||||
| O3 | Spectrophotometric-gas phase, including ultraviolet absorption and DOAS) | 0.5 | 0.5 | 0.5 | 4 0.08 | 0.02 | 20,000 | |||||||||
| CO | Non-dispersive Infrared | 750 | 20,000 | 4 10 | ||||||||||||
| CO | Gas chromatography with flame ionization detector | 20,000 | 4 10 | 0.5 | ||||||||||||
| CO | Electrochemical | 0.5 | 0.2 | 20,000 | 4 10 | |||||||||||
| CO | Catalytic combustion-thermal detection | 0.1 | 750 | 0.2 | 20,000 | 4 10 | 5.0 | 0.5 | ||||||||
| CO | IR fluorescence | 750 | 20,000 | 4 10 | 0.5 | |||||||||||
| CO | Mercury replacement-UV photometric | 0.2 | 4 10 | 0.5 | ||||||||||||
| NO2 | Chemiluminescent | 3 0.1 | 0.5 | 4 0.1 | 0.5 | 20,000 | ||||||||||
| NO2 | Spectrophotometric-wet chemical (azo-dye reaction) | 0.5 | 4 0.1 | 0.5 | 750 | 0.5 | ||||||||||
| NO2 | Electrochemical | 0.2 | 3 0.1 | 0.5 | 4 0.1 | 0.5 | 750 | 0.5 | 20,000 | 50 | ||||||
| NO2 | Spectrophotometric-gas phase | 3 0.1 | 0.5 | 4 0.1 | 0.5 | 0.5 | 20,000 | 50 |
1 Concentrations of interferent listed must be prepared and controlled to ±10 percent of the stated value.
2 Analyzer types not listed will be considered by the Administrator as special cases.
3 Do not mix with the pollutant.
4 Concentration of pollutant used for test. These pollutant concentrations must be prepared to ±10 percent of the stated value.
5 If candidate method utilizes an elevated-temperature scrubber for removal of aromatic hydrocarbons, perform this interference test.
6 If naphthalene test concentration cannot be accurately quantified, remove the scrubber, use a test concentration that causes a full scale response, reattach the scrubber, and evaluate response for interference.
Table B-4 to Subpart B of Part 53 - Line Voltage and Room Temperature Test Conditions
40:6.0.1.1.1.2.1.5.7 :
Table B-4 to Subpart B of Part 53 - Line Voltage and Room Temperature Test Conditions| Test day | Line voltage, 1 rms |
Room temperature, 2 °C |
Comments |
|---|---|---|---|
| 0 | 115 | 25 | Initial set-up and adjustments. |
| 1 | 125 | 20 | |
| 2 | 105 | 20 | |
| 3 | 125 | 30 | Adjustments and/or periodic maintenance permitted at end of tests. |
| 4 | 105 | 30 | |
| 5 | 125 | 20 | |
| 6 | 105 | 20 | Adjustments and/or periodic maintenance permitted at end of tests. |
| 7 | 125 | 30 | Examine test results to ascertain if further testing is required. |
| 8 | 105 | 30 | |
| 9 | 125 | 20 | Adjustments and/or periodic maintenance permitted at end of tests. |
| 10 | 105 | 20 | |
| 11 | 125 | 30 | |
| 12 | 105 | 30 | Adjustments and/or periodic maintenance permitted at end of tests. |
| 13 | 125 | 20 | |
| 14 | 105 | 20 | |
| 15 | 125 | 30 |
1 Voltage specified shall be controlled to ±1 volt.
2 Temperatures shall be controlled to ±1 °C.
Table B-5 to Subpart B of Part 53 - Symbols and Abbreviations
40:6.0.1.1.1.2.1.5.8 :
Table B-5 to Subpart B of Part 53 - Symbols and Abbreviations BL - Analyzer reading at the specified LDL test concentration for the LDL test. BZ - analyzer reading at 0 concentration for the LDL test. DM - Digital meter. Cmax - Maximum analyzer reading during the 12ZD test period. Cmin - Minimum analyzer reading during the 12ZD test period. i - Subscript indicating the i-th quantity in a series. IE - Interference equivalent. L1 - First analyzer zero reading for the 24ZD test. L2 - Second analyzer zero reading for the 24ZD test. n - Subscript indicating the test day number. P - Analyzer reading for the span drift and precision tests. Pi - The i-th analyzer reading for the span drift and precision tests. P20 - Precision at 20 percent of URL. P80 - Precision at 80 percent of URL. ppb - Parts per billion of pollutant gas (usually in air), by volume. ppm - Parts per million of pollutant gas (usually in air), by volume. R - Analyzer reading of pollutant alone for the IE test. R1 - Analyzer reading with interferent added for the IE test. ri - the i-th analyzer or DM reading for the noise test. S - Standard deviation of the noise test readings. S0 - Noise value (S) measured at 0 concentration. S80 - Noise value (S) measured at 80 percent of the URL. Sn - Average of P7 . . . P12 for the n-th test day of the SD test. S'n - Adjusted span reading on the n-th test day. SD - Span drift URL - Upper range limit of the analyzer's measurement range. Z - Average of L1 and L2 readings for the 24ZD test. Zn - Average of L1 and L2 readings on the n-th test day for the 24ZD test. Z'n - Adjusted analyzer zero reading on the n-the test day for the 24ZD test. ZD - Zero drift. 12ZD - 12-hour zero drift. 24ZD - 24-hour zero drift.Appendix A to Subpart B of Part 53 - Optional Forms for Reporting Test Results
40:6.0.1.1.1.2.1.5.9 : Appendix A
Appendix A to Subpart B of Part 53 - Optional Forms for Reporting Test Results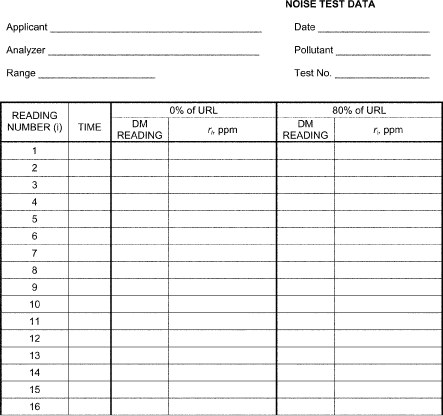
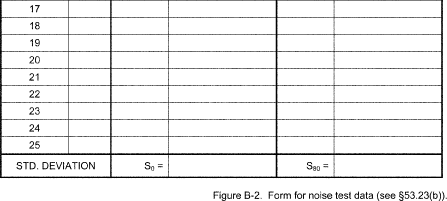
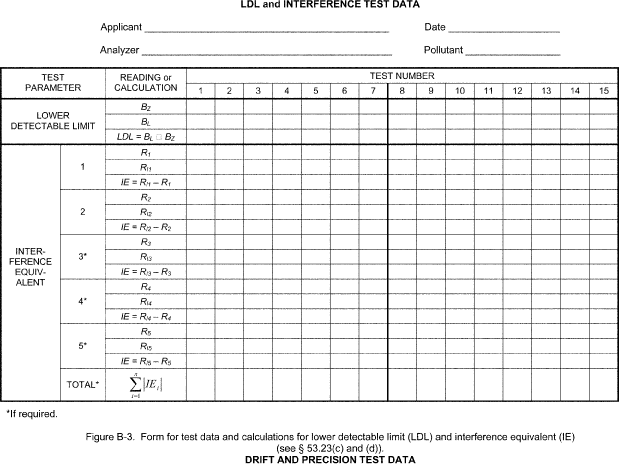
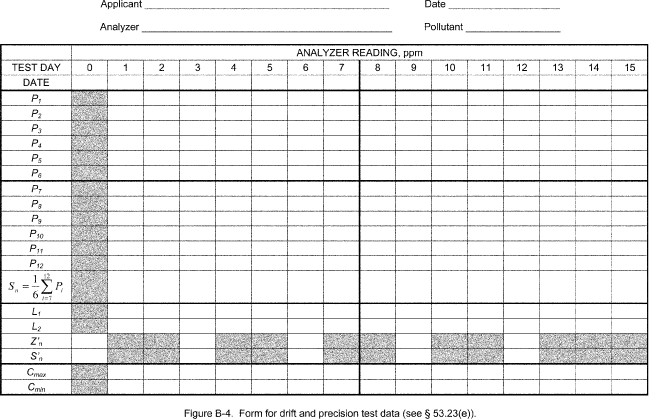
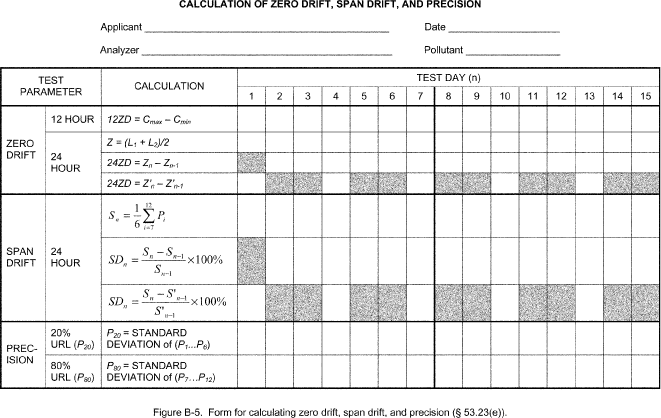
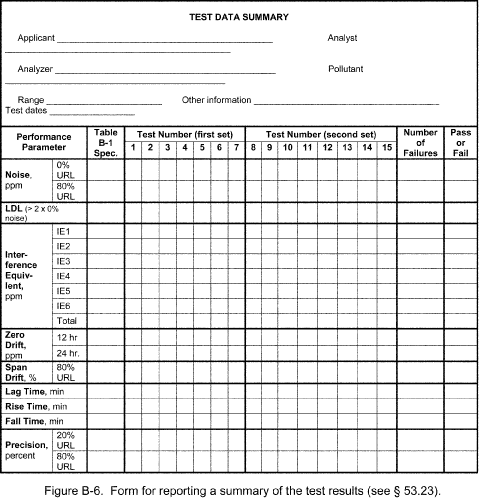
Table C-1 to Subpart C of Part 53 - Test Concentration Ranges, Number of Measurements Required, and Maximum Discrepancy Specifications
40:6.0.1.1.1.3.1.7.10 :
Table C-1 to Subpart C of Part 53 - Test Concentration Ranges, Number of Measurements Required, and Maximum Discrepancy Specifications| Pollutant | Concentration range, parts per million (ppm) | Simultaneous measurements required | Maximum discrepancy specification, parts per million |
|||
|---|---|---|---|---|---|---|
| 1-hour | 24-hour | |||||
| First set | Second set | First set | Second set | |||
| Ozone | Low 0.06 to 0.10 | 5 | 6 | 0.02 | ||
| Med. 0.15 to 0.25 | 5 | 6 | 0.03 | |||
| High 0.35 to 0.46 | 4 | 6 | 0.04 | |||
| Total | 14 | 18 | ||||
| Carbon monoxide | Low 7 to 11 | 5 | 6 | 1.5 | ||
| Med. 20 to 30 | 5 | 6 | 2.0 | |||
| High 25 to 45 | 4 | 6 | 3.0 | |||
| Total | 14 | 18 | ||||
| Sulfur dioxide | Low 0.02 to 0.05 | 5 | 6 | 3 | 3 | 0.02 |
| Med. 0.10 to 0.15 | 5 | 6 | 2 | 3 | 0.03 | |
| High 0.30 to 0.50 | 4 | 6 | 2 | 2 | 0.04 | |
| Total | 14 | 18 | 7 | 8 | ||
| Nitrogen dioxide | Low 0.02 to 0.08 | 3 | 3 | 0.02 | ||
| Med. 0.10 to 0.20 | 2 | 2 | 0.02 | |||
| High 0.25 | 2 | 2 | 0.03 | |||
| Total | 7 | 8 | ||||
Table C-2 to Subpart C of Part 53 - Sequence of Test Measurements
40:6.0.1.1.1.3.1.7.11 :
Table C-2 to Subpart C of Part 53 - Sequence of Test Measurements| Measurement | Concentration range | |
|---|---|---|
| First set | Second set | |
| 1 | Low | Medium. |
| 2 | High | High. |
| 3 | Medium | Low. |
| 4 | High | High. |
| 5 | Low | Medium. |
| 6 | Medium | Low. |
| 7 | Low | Medium. |
| 8 | Medium | Low. |
| 9 | High | High. |
| 10 | Medium | Low. |
| 11 | High | Medium. |
| 12 | Low | High. |
| 13 | Medium | Medium. |
| 14 | Low | High. |
| 15 | Low. | |
| 16 | Medium. | |
| 17 | Low. | |
| 18 | High. | |
Table C-3 to Subpart C of Part 53 - Test Specifications for Pb in TSP and Pb in PM 10 Methods
40:6.0.1.1.1.3.1.7.12 :
Table C-3 to Subpart C of Part 53 - Test Specifications for Pb in TSP and Pb in PM 10 Methods| Concentration range equivalent to percentage of NAAQS in µg/m 3 | 30% to 250% |
| Minimum number of 24-hr measurements | 5 |
| Maximum reference method analytical bias, Dq | ±5% |
| Maximum precision, PR or PC | ≤15% |
| Maximum difference (D) | ±20% |
| Estimated Method Detection Limit (MDL), µg/m 3 | 5% of NAAQS level. |
Table C-4 to Subpart C of Part 53 - Test Specifications for PM 10, PM 2.5 and PM 10-2.5 Candidate Equivalent Methods
40:6.0.1.1.1.3.1.7.13 :
Table C-4 to Subpart C of Part 53 - Test Specifications for PM 10, PM 2.5 and PM 10-2.5 Candidate Equivalent Methods| Specification | PM 10 | PM 2.5 | PM 10-2.5 | |||
|---|---|---|---|---|---|---|
| Class I | Class II | Class III | Class II | Class III | ||
| Acceptable concentration range (Rj), µg/m 3 | 15-300 | 3-200 | 3-200 | 3-200 | 3-200 | 3-200 |
| Minimum number of test sites | 2 | 1 | 2 | 4 | 2 | 4 |
| Minimum number of candidate method samplers or analyzers per site | 3 | 3 | 3 1 | 3 1 | 3 1 | 3 1 |
| Number of reference method samplers per site | 3 | 3 | 3 1 | 3 1 | 3 1 | 3 1 |
| Minimum number of acceptable sample sets per site for PM 10 methods: | ||||||
| Rj <60 µg/m 3 | 3 | |||||
| Rj >60 µg/m 3 | 3 | |||||
| Total | 10 | |||||
| Minimum number of acceptable sample sets per site for PM 2.5 and PM 10-2.5 candidate equivalent methods: | ||||||
| Rj <30 µg/m 3 for 24-hr or Rj <20 µg/m 3 for 48-hr samples | 3 | |||||
| Rj >30 µg/m 3 for 24-hr or Rj >20 µg/m 3 for 48-hr samples | 3 | |||||
| Each season | 10 | 23 | 23 | 23 | 23 | |
| Total, each site | 10 | 23 | 23 (46 for two-season sites) | 23 | 23 (46 for two-season sites) | |
| Precision of replicate reference method measurements, PRj or RPRj, respectively; RP for Class II or III PM 2.5 or PM 10-2.5, maximum | 5 µg/m 3 or 7% | 2 µg/m 3 or 5% | 10% 2 | 10% 2 | 10% 2 | 10% 2 |
| Precision of PM 2.5 or PM 10-2.5 candidate method, CP, each site | 10% 2 | 15% 2 | 15% 2 | 15% 2 | ||
| Slope of regression relationship | 1 ±0.10 | 1 ±0.05 | 1 ±0.10 | 1 ±0.10 | 1 ±0.10 | 1 ±0.12 |
| Intercept of regression relationship, µg/m 3 | 0 ±5 | 0 ±1 | Between: 13.55 − (15.05 × slope), but not less than −1.5; and 16.56 − (15.05 × slope), but not more than + 1.5 | Between: 15.05 − (17.32 × slope), but not less than −2.0; and 15.05 − (13.20 × slope), but not more than + 2.0 | Between: 62.05 − (70.5 × slope), but not less than −3.5; and 78.95 − (70.5 × slope), but not more than + 3.5 | Between: 70.50 − (82.93 × slope), but not less than −7.0; and 70.50 − (61.16 × slope), but not more than + 7.0 |
| Correlation of reference method and candidate method measurements | ≥0.97 | ≥0.97 | ≥0.93 - for CCV ≤0.4; ≥0.85 + 0.2 × CCV - for 0.4 ≤CCV ≤0.5; ≥0.95 - for CCV ≥0.5 | |||
1 Some missing daily measurement values may be permitted; see test procedure.
2 Calculated as the root mean square over all measurement sets.
Table C-5 to Subpart C of Part 53 - Summary of Comparability Field Testing Campaign Site and Seasonal Requirements for Class II and III FEMs for PM 10-2.5 and PM 2.5
40:6.0.1.1.1.3.1.7.14 :
Table C-5 to Subpart C of Part 53 - Summary of Comparability Field Testing Campaign Site and Seasonal Requirements for Class II and III FEMs for PM 10-2.5 and PM 2.5| Candidate method | Test site | A | B | C | D |
|---|---|---|---|---|---|
| PM 2.5 | Test site location area | Los Angeles basin or California Central Valley | Western city such as Denver, Salt Lake City, or Albuquerque | Midwestern city | Northeastern or mid-Atlantic city. |
| Test site characteristics | Relatively high PM 2.5, nitrates, and semi-volatile organic pollutants | Cold weather, higher elevation, winds, and dust | Substantial temperature variation, high nitrates, wintertime conditions | High sulfate and high relative humidity. | |
| Class III Field test campaigns (Total: 5) | Winter and summer | Winter only | Winter only | Summer only. | |
| Class II Field test campaigns (Total: 2) | Site A or B, any season | Site C or D, any season. | |||
| PM 10-2.5 | Test site location area | Los Angeles basin or California Central Valley | Western city such as Las Vegas or Phoenix | Midwestern city | Large city east of the Mississippi River. |
| Test site characteristics | Relatively high PM 2.5, nitrates, and semi-volatile organic pollutants | High PM 10-2.5 to PM 2.5 ratio, windblown dust | Substantial temperature variation, high nitrates, wintertime conditions | High sulfate and high relative humidity. | |
| Class III Field test campaigns (Total: 5) | Winter and summer | Winter only | Winter only | Summer only. | |
| Class II Field test campaigns (Total: 2) | Site A or B, any season | Site C or D, any season. | |||
Figure C-1 to Subpart C of Part 53 - Suggested Format for Reporting Test Results for Methods for SO 2, CO, O 3, NO 2
40:6.0.1.1.1.3.1.7.15 :
Figure C-1 to Subpart C of Part 53 - Suggested Format for Reporting Test Results for Methods for SO 2, CO, O 3, NO 2 Candidate Method Reference Method Applicant □ First Set □ Second Set □ Type □ 1 Hour □ 24 Hour| Concentration range | Date | Time | Concentration, ppm | Difference | Table C-1 spec. | Pass or fail | ||
|---|---|---|---|---|---|---|---|---|
| Candidate | Reference | |||||||
| Low | 1 | |||||||
| ____ ppm | 2 | |||||||
| to ____ ppm | 3 | |||||||
| 4 | ||||||||
| 5 | ||||||||
| 6 | ||||||||
| Medium | 1 | |||||||
| ____ ppm | 2 | |||||||
| to ____ ppm | 3 | |||||||
| 4 | ||||||||
| 5 | ||||||||
| 6 | ||||||||
| High | 1 | |||||||
| ____ ppm | 2 | |||||||
| to ____ ppm | 3 | |||||||
| 4 | ||||||||
| 5 | ||||||||
| 6 | ||||||||
| 7 | ||||||||
| 8 | ||||||||
| Total Failures: | ||||||||
Figure C-2 to Subpart C of Part 53 - Illustration of the Slope and Intercept Limits for Class II and Class III PM 2.5 Candidate Equivalent Methods
40:6.0.1.1.1.3.1.7.16 :
Figure C-2 to Subpart C of Part 53 - Illustration of the Slope and Intercept Limits for Class II and Class III PM 2.5 Candidate Equivalent Methods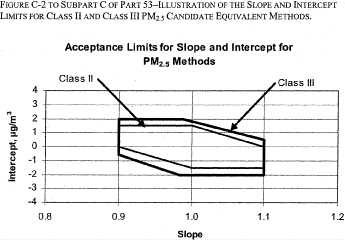 [72 FR 32204, June
12, 2007]
[72 FR 32204, June
12, 2007]Figure C-3 to Subpart C of Part 53 - Illustration of the Slope and Intercept Limits for Class II and Class III PM 10-2.5 Candidate Equivalent Methods
40:6.0.1.1.1.3.1.7.17 :
Figure C-3 to Subpart C of Part 53 - Illustration of the Slope and Intercept Limits for Class II and Class III PM 10-2.5 Candidate Equivalent Methods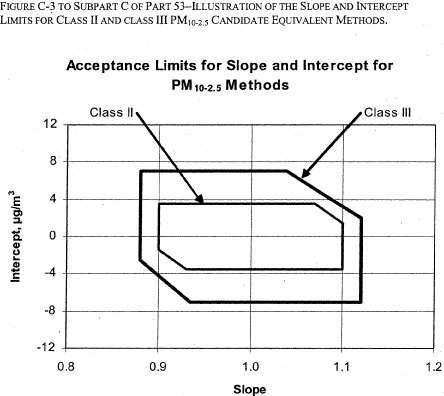 [72 FR 32204, June
12, 2007]
[72 FR 32204, June
12, 2007]Figure C-4 to Subpart C of Part 53 - Illustration of the Minimum Limits for Correlation Coefficient for PM 2.5 and PM 10-2.5 Class II and III Methods
40:6.0.1.1.1.3.1.7.18 :
Figure C-4 to Subpart C of Part 53 - Illustration of the Minimum Limits for Correlation Coefficient for PM 2.5 and PM 10-2.5 Class II and III Methods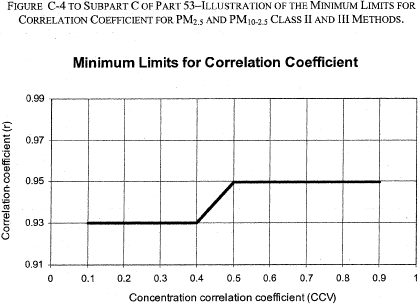 [72 FR 32204, June
12, 2007]
[72 FR 32204, June
12, 2007]Appendix A to Subpart C of Part 53 - References
40:6.0.1.1.1.3.1.7.19 : Appendix A
Appendix A to Subpart C of Part 53 - References(1) American National Standard Quality Systems for Environmental Data and Technology Programs - Requirements with guidance for use, ANSI/ASQC E4-2004. Available from American Society for Quality, P.O. Box 3005, Milwaukee, WI 53202 (http://qualitypress.asq.org).
(2) Quality Assurance Guidance Document 2.12. Monitoring PM 2.5 in Ambient Air Using Designated Reference or Class I Equivalent Methods. U.S. EPA, National Exposure Research Laboratory, Research Triangle Park, NC, November 1998 or later edition. Currently available at http://www.epa.gov/ttn/amtic/pmqainf.html.
Table E-1 to Subpart E of Part 53 - Summary of Test Requirements for Reference and Class I Equivalent Methods for PM 2.5 and PM 10-2.5
40:6.0.1.1.1.5.1.11.20 :
Table E-1 to Subpart E of Part 53 - Summary of Test Requirements for Reference and Class I Equivalent Methods for PM 2.5 and PM 10-2.5| Subpart E procedure | Performance test | Performance specification | Test conditions | Part 50, appendix L reference |
|---|---|---|---|---|
| § 53.52 Sample leak check test | Sampler leak check facility | External leakage: 80 mL/min,
max Internal leakage: 80 mL/min, max |
Controlled leak flow rate of 80 mL/min | Sec. 7.4.6. |
| § 53.53 Base flow rate test | Sample flow rate 1. Mean 2. Regulation 3. Meas accuracy 4. CV accuracy 5. Cut-off |
1. 16.67 ±5%, L/min 2. 2%, max 3. 2%, max 4. 0.3% max 5. Flow rate cut-off if flow rate deviates more than 10% from design flow rate for >60 ±30 seconds |
(a) 6-hour normal operational
test plus flow rate cut-off test (b) Normal conditions (c) Additional 55 mm Hg pressure drop to simulate loaded filter (d) Variable flow restriction used for cut-off test |
Sec. 7.4.1. Sec. 7.4.2. Sec. 7.4.3. Sec. 7.4.4. Sec. 7.4.5. |
| § 53.54 Power interruption test | Sample flow rate 1. Mean 2. Regulation 3. Meas. accuracy 4. CV accuracy 5. Occurrence time of power interruptions 6. Elapsed sample time 7. Sample volume |
1. 16.67 ±5%, L/min 2. 2%, max 3. 2%, max 4. 0.3% max 5. ±2 min if >60 seconds. 6. ±20 seconds 7. ±2%, max |
(a) 6-hour normal operational
test (b) Nominal conditions (c) Additional 55 mm Hg pressure drop to simulate loaded filter (d) 6 power interruptions of various durations |
Sec. 7.4.1. Sec. 7.4.2. Sec. 7.4.3. Sec. 7.4.5. Sec. 7.4.12. Sec. 7.4.13. Sec. 7.4.15.4. Sec. 7.4.15.5. |
| § 53.55 Temperature and line voltage test | Sample flow rate 1. Mean 2. Regulation 3. Meas. accuracy 4. CV accuracy 5. Temperature meas. accuracy 6. Proper operation. |
1. 16.67 ±5%, L/min 2. 2%, max 3. 2%, max 4. 0.3% max 5. 2 °C |
(a) 6-hour normal operational
test (b) Normal conditions (c) Additional 55 mm Hg pressure drop to simulate loaded filter (d) Ambient temperature at −20 and + 40 °C (e) Line voltage: 105 Vac to 125 Vac |
Sec. 7.4.1. Sec. 7.4.2. Sec. 7.4.3. Sec. 7.4.5. Sec. 7.4.8. Sec. 7.4.15.1. |
| § 53.56 Barometric pressure effect test | Sample flow rate 1. Mean 2. Regulation 3. Meas. accuracy 4. CV accuracy 5. Pressure meas. accuracy 6. Proper operation. |
1. 16.67 ±5%, L/p;min 2. 2%, max 3. 2%, max 4. 0.3% max 5. 10 mm Hg |
(a) 6-hour normal operational
test (b) Normal conditions (c) Additional 55 mm Hg pressure drop to simulate loaded filter (d) Barometric pressure at 600 and 800 mm Hg |
Sec. 7.4.1. Sec. 7.4.2. Sec. 7.4.3. Sec. 7.4.5. Sec. 7.4.9. |
| § 53.57 Filter temperature control test | 1. Filter temp. meas.
accuracy 2. Ambient temp. meas. accuracy 3. Filter temp. control accuracy, sampling and non-sampling |
1. 2 °C 2. 2 °C 3. Not more than 5 °C above ambient temp. for more than 30 min |
(a) 4-hour simulated solar
radiation, sampling (b) 4-hour simulated solar radiation, non-sampling (c) Solar flux of 1000 ±50 W/m 2 |
Sec. 7.4.8. Sec. 7.4.10. Sec. 7.4.11. |
| § 53.58 Field precision test | 1. Measurement precision 2. Storage deposition test for sequential samplers |
1. Pj <2 µg/m 3
or RPj <5% 2. 50 µg max. average weight gain/blank filter |
(a) 3 collocated samplers at 1
site for at least 10 days (b) PM 2.5 conc. >3 µg/m 3 (c) 24- or 48-hour samples (d) 5- or 10-day storage period for inactive stored filters |
Sec. 5.1. Sec. 7.3.5. Sec. 8. Sec. 9. Sec. 10. |
| The Following Requirement Is Applicable to Class I Candidate Equivalent Methods Only | ||||
| § 53.59 Aerosol transport test | Aerosol transport | 97%, min. for all channels. | Determine aerosol transport through any new or modified components with respect to the reference method sampler before the filter for each channel | |
Table E-2 to Subpart E of Part 53 - Spectral Energy Distribution and Permitted Tolerance for Conducting Radiative Tests
40:6.0.1.1.1.5.1.11.21 :
Table E-2 to Subpart E of Part 53 - Spectral Energy Distribution and Permitted Tolerance for Conducting Radiative Tests| Characteristic | Spectral Region | ||
|---|---|---|---|
| Ultraviolet | Visible | Infrared | |
| Bandwidth (µm) | 0.28 to 0.32 0.32 to 0.40 | 0.40 to 0.78 | 0.78 to 3.00 |
| Irradiance (W/m 2) | 5 56 | 450 to 550 | 439 |
| Allowed Tolerance | ±35% ±25% | ±10% | ±10% |
Figure E-1 to Subpart E of Part 53 - Designation Testing Checklist
40:6.0.1.1.1.5.1.11.22 :
Figure E-1 to Subpart E of Part 53 - Designation Testing Checklist DESIGNATION TESTING CHECKLIST__________ __________ __________
Auditee Auditor signature Date
| Compliance Status: Y = Yes N = No NA = Not applicable/Not available | Verification Comments (Includes documentation of who, what, where, when, why) (Doc. #, Rev. #, Rev. Date) | |||
|---|---|---|---|---|
| Verification | Verified by Direct Observation of Process or of Documented Evidence: Performance, Design or Application Spec. Corresponding to Sections of 40 CFR Part 53 or 40 CFR Part 50, Appendix L | |||
| Y | N | NA | ||
| Performance Specification Tests | ||||
| Sample flow rate coefficient of variation (§ 53.53) (L-7.4.3) | ||||
| Filter temperature control (sampling) (§ 53.57) (L-7.4.10) | ||||
| Elapsed sample time accuracy (§ 53.54) (L-7.4.13) | ||||
| Filter temperature control (post sampling) (§ 53.57) (L-7.4.10) | ||||
| Application Specification Tests | ||||
| Field Precision (§ 53.58) (L-5.1) | ||||
| Meets all Appendix L requirements (part 53, subpart A, § 53.2(a)(3)) (part 53, subpart E, § 53.51(a),(d)) | ||||
| Filter Weighing (L-8) | ||||
| Field Sampling Procedure (§ 53.30, .31, .34) | ||||
| Design Specification Tests | ||||
| Filter (L-6) | ||||
| Range of Operational Conditions (L-7.4.7) | ||||
| The Following Requirements Apply Only to Class I Candidate Equivalent Methods | ||||
| Aerosol Transport (§ 53.59) | ||||
Appendix A to Subpart E of Part 53 - References
40:6.0.1.1.1.5.1.11.23 : Appendix A
Appendix A to Subpart E of Part 53 - References(1) American National Standard Quality Systems - Model for Quality Assurance in Design, Development, Production, Installation, and Servicing, ANSI/ISO/ASQC Q9001-1994. Available from American Society for Quality, P.O. Box 3005, Milwaukee, WI 53202 (http://qualitypress.asq.org).
(2) American National Standard Quality Systems for Environmental Data and Technology Programs - Requirements with guidance for use, ANSI/ASQC E4-2004. Available from American Society for Quality, P.O. Box 3005, Milwaukee, WI 53202 (http://qualitypress.asq.org).
(3) Quality Assurance Guidance Document 2.12. Monitoring PM 2.5 in Ambient Air Using Designated Reference or Class I Equivalent Methods. U.S. EPA, National Exposure Research Laboratory, Research Triangle Park, NC, November 1998 or later edition. Currently available at http://www.epa.gov/ttn/amtic/pmqainf.html.
(4) Military standard specification (mil. spec.) 8625F, Type II, Class 1 as listed in Department of Defense Index of Specifications and Standards (DODISS), available from DODSSP-Customer Service, Standardization Documents Order Desk, 700 Robbins Avenue, Building 4D, Philadelphia, PA 1911-5094.
(5) Quality Assurance Handbook for Air Pollution Measurement Systems, Volume IV: Meteorological Measurements. Revised March, 1995. EPA-600/R-94-038d. Available from National Technical Information Service, Springfield, VA 22161, (800-553-6847, http://www.ntis.gov). NTIS number PB95-199782INZ.
(6) Military standard specification (mil. spec.) 810-E as listed in Department of Defense Index of Specifications and Standards (DODISS), available from DODSSP-Customer Service, Standardization Documents Order Desk, 700 Robbins Avenue, Building 4D, Philadelphia, PA 1911-5094.
[62 FR 38799, July 18, 1997, as amended at 71 FR 61295, Oct. 17, 2006]Table F-1 to Subpart F of Part 53 - Performance Specifications for PM 2.5 Class II Equivalent Samplers
40:6.0.1.1.1.6.1.8.24 :
Table F-1 to Subpart F of Part 53 - Performance Specifications for PM 2.5 Class II Equivalent Samplers| Performance test | Specifications | Acceptance criteria |
|---|---|---|
| § 53.62 Full Wind Tunnel Evaluation | Solid VOAG produced aerosol at 2 km/hr and 24 km/hr | Dp50 = 2.5 µm ±0.2 µm Numerical Analysis Results: 95% ≤Rc ≤105%. |
| § 53.63 Wind Tunnel Inlet Aspiration Test | Liquid VOAG produced aerosol at 2 km/hr and 24 km/hr | Relative Aspiration: 95% ≤A ≤105%. |
| § 53.64 Static Fractionator Test | Evaluation of the fractionator under static conditions | Dp50 = 2.5 µm ±0.2 µm Numerical Analysis Results: 95% ≤Rc ≤105%. |
| § 53.65 Loading Test | Loading of the clean candidate under laboratory conditions | Acceptance criteria as specified in the post-loading evaluation test (§ 53.62, § 53.63, or § 53.64). |
| § 53.66 Volatility Test | Polydisperse liquid aerosol produced by air nebulization of A.C.S. reagent grade glycerol, 99.5% minimum purity | Regression Parameters Slope = 1 ±0.1, Intercept = 0 ±0.15 mg, r ≥0.97. |
Table F-2 to Subpart F of Part 53 - Particle Sizes and Wind Speeds for Full Wind Tunnel Test, Wind Tunnel Inlet Aspiration Test, and Static Chamber Test
40:6.0.1.1.1.6.1.8.25 :
Table F-2 to Subpart F of Part 53 - Particle Sizes and Wind Speeds for Full Wind Tunnel Test, Wind Tunnel Inlet Aspiration Test, and Static Chamber Test| Primary Partical Mean Size a (µm) | Full Wind Tunnel Test | Inlet Aspiration Test | Static Fractionator Test | Volatility Test | ||
|---|---|---|---|---|---|---|
| 2 km/hr | 24 km/hr | 2 km/hr | 24 km/hr | |||
| 1.5±0.25 | S | S | S | |||
| 2.0±0.25 | S | S | S | |||
| 2.2±0.25 | S | S | S | |||
| 2.5±0.25 | S | S | S | |||
| 2.8±0.25 | S | S | S | |||
| 3.0±0.25 | L | L | ||||
| 3.5±0.25 | S | S | S | |||
| 4.0±0.5 | S | S | S | |||
| Polydisperse Glycerol Aerosol | L | |||||
a Aerodynamic diameter.
S = Solid particles.
L = Liquid particles.
Table F-3 to Subpart F of Part 53 - Critical Parameters of Idealized Ambient Particle Size Distributions
40:6.0.1.1.1.6.1.8.26 :
Table F-3 to Subpart F of Part 53 - Critical Parameters of Idealized Ambient Particle Size Distributions| Idealized Distribution | Fine Particle Mode | Coarse Particle Mode | PM 2.5/PM 10 Ratio | FRM Sampler Expected Mass Conc. (µg/m 3) | ||||
|---|---|---|---|---|---|---|---|---|
| MMD (µm) | Geo. Std. Dev. | Conc. (µg/m 3) | MMD (µm) | Geo. Std. Dev. | Conc. (µg/m 3) | |||
| Coarse | 0.50 | 2 | 12.0 | 10 | 2 | 88.0 | 0.27 | 13.814 |
| “Typical” | 0.50 | 2 | 33.3 | 10 | 2 | 66.7 | 0.55 | 34.284 |
| Fine | 0.85 | 2 | 85.0 | 15 | 2 | 15.0 | 0.94 | 78.539 |
Table F-4 to Subpart F of Part 53 - Estimated Mass Concentration Measurement of PM 2.5 for Idealized Coarse Aerosol Size Distribution
40:6.0.1.1.1.6.1.8.27 :
Table F-4 to Subpart F of Part 53 - Estimated Mass Concentration Measurement of PM 2.5 for Idealized Coarse Aerosol Size Distribution| Particle Aerodynamic Diameter (µm) | Test Sampler | Ideal Sampler | ||||
|---|---|---|---|---|---|---|
| Fractional Sampling Effectiveness | Interval Mass Concentration (µg/m 3) | Estimated Mass Concentration Measurement (µg/m 3) | Fractional Sampling Effectiveness | Interval Mass Concentration (µg/m 3) | Estimated Mass Concentration Measurement (µg/m 3) | |
| (1) | (2) | (3) | (4) | (5) | (6) | (7) |
| <0.500 | 1.000 | 6.001 | 1.000 | 6.001 | 6.001 | |
| 0.625 | 2.129 | 0.999 | 2.129 | 2.127 | ||
| 0.750 | 0.982 | 0.998 | 0.982 | 0.980 | ||
| 0.875 | 0.730 | 0.997 | 0.730 | 0.728 | ||
| 1.000 | 0.551 | 0.995 | 0.551 | 0.548 | ||
| 1.125 | 0.428 | 0.991 | 0.428 | 0.424 | ||
| 1.250 | 0.346 | 0.987 | 0.346 | 0.342 | ||
| 1.375 | 0.294 | 0.980 | 0.294 | 0.288 | ||
| 1.500 | 0.264 | 0.969 | 0.264 | 0.256 | ||
| 1.675 | 0.251 | 0.954 | 0.251 | 0.239 | ||
| 1.750 | 0.250 | 0.932 | 0.250 | 0.233 | ||
| 1.875 | 0.258 | 0.899 | 0.258 | 0.232 | ||
| 2.000 | 0.272 | 0.854 | 0.272 | 0.232 | ||
| 2.125 | 0.292 | 0.791 | 0.292 | 0.231 | ||
| 2.250 | 0.314 | 0.707 | 0.314 | 0.222 | ||
| 2.375 | 0.339 | 0.602 | 0.339 | 0.204 | ||
| 2.500 | 0.366 | 0.480 | 0.366 | 0.176 | ||
| 2.625 | 0.394 | 0.351 | 0.394 | 0.138 | ||
| 2.750 | 0.422 | 0.230 | 0.422 | 0.097 | ||
| 2.875 | 0.449 | 0.133 | 0.449 | 0.060 | ||
| 3.000 | 0.477 | 0.067 | 0.477 | 0.032 | ||
| 3.125 | 0.504 | 0.030 | 0.504 | 0.015 | ||
| 3.250 | 0.530 | 0.012 | 0.530 | 0.006 | ||
| 3.375 | 0.555 | 0.004 | 0.555 | 0.002 | ||
| 3.500 | 0.579 | 0.001 | 0.579 | 0.001 | ||
| 3.625 | 0.602 | 0.000000 | 0.602 | 0.000000 | ||
| 3.750 | 0.624 | 0.000000 | 0.624 | 0.000000 | ||
| 3.875 | 0.644 | 0.000000 | 0.644 | 0.000000 | ||
| 4.000 | 0.663 | 0.000000 | 0.663 | 0.000000 | ||
| 4.125 | 0.681 | 0.000000 | 0.681 | 0.000000 | ||
| 4.250 | 0.697 | 0.000000 | 0.697 | 0.000000 | ||
| 4.375 | 0.712 | 0.000000 | 0.712 | 0.000000 | ||
| 4.500 | 0.726 | 0.000000 | 0.726 | 0.000000 | ||
| 4.625 | 0.738 | 0.000000 | 0.738 | 0.000000 | ||
| 4.750 | 0.750 | 0.000000 | 0.750 | 0.000000 | ||
| 4.875 | 0.760 | 0.000000 | 0.760 | 0.000000 | ||
| 5.000 | 0.769 | 0.000000 | 0.769 | 0.000000 | ||
| 5.125 | 0.777 | 0.000000 | 0.777 | 0.000000 | ||
| 5.250 | 0.783 | 0.000000 | 0.783 | 0.000000 | ||
| 5.375 | 0.789 | 0.000000 | 0.789 | 0.000000 | ||
| 5.500 | 0.794 | 0.000000 | 0.794 | 0.000000 | ||
| 5.625 | 0.798 | 0.000000 | 0.798 | 0.000000 | ||
| 5.75 | 0.801 | 0.000000 | 0.801 | 0.000000 | ||
| Csam(exp)= | Cideal(exp)= | 13.814 | ||||
Table F-5 to Subpart F of Part 53 - Estimated Mass Concentration Measurement of PM 2.5 for Idealized “Typical” Coarse Aerosol Size Distribution
40:6.0.1.1.1.6.1.8.28 :
Table F-5 to Subpart F of Part 53 - Estimated Mass Concentration Measurement of PM 2.5 for Idealized “Typical” Coarse Aerosol Size Distribution| Particle Aerodynamic Diameter (µm) | Test Sampler | Ideal Sampler | ||||
|---|---|---|---|---|---|---|
| Fractional Sampling Effectiveness | Interval Mass Concentration (µg/m 3) | Estimated Mass Concentration Measurement (µg/m 3) | Fractional Sampling Effectiveness | Interval Mass Concentration (µg/m 3) | Estimated Mass Concentration Measurement (µg/m 3) | |
| (1) | (2) | (3) | (4) | (5) | (6) | (7) |
| <0.500 | 1.000 | 16.651 | 1.000 | 16.651 | 16.651 | |
| 0.625 | 5.899 | 0.999 | 5.899 | 5.893 | ||
| 0.750 | 2.708 | 0.998 | 2.708 | 2.703 | ||
| 0.875 | 1.996 | 0.997 | 1.996 | 1.990 | ||
| 1.000 | 1.478 | 0.995 | 1.478 | 1.471 | ||
| 1.125 | 1.108 | 0.991 | 1.108 | 1.098 | ||
| 1.250 | 0.846 | 0.987 | 0.846 | 0.835 | ||
| 1.375 | 0.661 | 0.980 | 0.661 | 0.648 | ||
| 1.500 | 0.532 | 0.969 | 0.532 | 0.516 | ||
| 1.675 | 0.444 | 0.954 | 0.444 | 0.424 | ||
| 1.750 | 0.384 | 0.932 | 0.384 | 0.358 | ||
| 1.875 | 0.347 | 0.899 | 0.347 | 0.312 | ||
| 2.000 | 0.325 | 0.854 | 0.325 | 0.277 | ||
| 2.125 | 0.314 | 0.791 | 0.314 | 0.248 | ||
| 2.250 | 0.312 | 0.707 | 0.312 | 0.221 | ||
| 2.375 | 0.316 | 0.602 | 0.316 | 0.190 | ||
| 2.500 | 0.325 | 0.480 | 0.325 | 0.156 | ||
| 2.625 | 0.336 | 0.351 | 0.336 | 0.118 | ||
| 2.750 | 0.350 | 0.230 | 0.350 | 0.081 | ||
| 2.875 | 0.366 | 0.133 | 0.366 | 0.049 | ||
| 3.000 | 0.382 | 0.067 | 0.382 | 0.026 | ||
| 3.125 | 0.399 | 0.030 | 0.399 | 0.012 | ||
| 3.250 | 0.416 | 0.012 | 0.416 | 0.005 | ||
| 3.375 | 0.432 | 0.004 | 0.432 | 0.002 | ||
| 3.500 | 0.449 | 0.001 | 0.449 | 0.000000 | ||
| 3.625 | 0.464 | 0.000000 | 0.464 | 0.000000 | ||
| 3.750 | 0.480 | 0.000000 | 0.480 | 0.000000 | ||
| 3.875 | 0.494 | 0.000000 | 0.494 | 0.000000 | ||
| 4.000 | 0.507 | 0.000000 | 0.507 | 0.000000 | ||
| 4.125 | 0.520 | 0.000000 | 0.520 | 0.000000 | ||
| 4.250 | 0.000000 | 0.532 | 0.000000 | |||
| 4.375 | 0.000000 | 0.543 | 0.000000 | |||
| 4.500 | 0.000000 | 0.553 | 0.000000 | |||
| 4.625 | 0.000000 | 0.562 | 0.000000 | |||
| 4.750 | 0.000000 | 0.570 | 0.000000 | |||
| 4.875 | 0.000000 | 0.577 | 0.000000 | |||
| 5.000 | 0.000000 | 0.584 | 0.000000 | |||
| 5.125 | 0.000000 | 0.590 | 0.000000 | |||
| 5.250 | 0.000000 | 0.595 | 0.000000 | |||
| 5.375 | 0.000000 | 0.599 | 0.000000 | |||
| 5.500 | 0.000000 | 0.603 | 0.000000 | |||
| 5.625 | 0.000000 | 0.605 | 0.000000 | |||
| 5.75 | 0.000000 | 0.608 | 0.000000 | |||
| Csam(exp)= | Cideal(exp)= | 34.284 | ||||
Table F-6 to Subpart F of Part 53 - Estimated Mass Concentration Measurement of PM 2.5 for Idealized Fine Aerosol Size Distribution
40:6.0.1.1.1.6.1.8.29 :
Table F-6 to Subpart F of Part 53 - Estimated Mass Concentration Measurement of PM 2.5 for Idealized Fine Aerosol Size Distribution| Particle Aerodynamic Diameter (µm) | Test Sampler | Ideal Sampler | ||||
|---|---|---|---|---|---|---|
| Fractional Sampling Effectiveness | Interval Mass Concentration (µg/m 3) | Estimated Mass Concentration Measurement (µg/m 3) | Fractional Sampling Effectiveness | Interval Mass Concentration (µg/m 3) | Estimated Mass Concentration Measurement (µg/m 3) | |
| (1) | (2) | (3) | (4) | (5) | (6) | (7) |
| <0.500 | 1.000 | 18.868 | 1.000 | 18.868 | 18.868 | |
| 0.625 | 13.412 | 0.999 | 13.412 | 13.399 | ||
| 0.750 | 8.014 | 0.998 | 8.014 | 7.998 | ||
| 0.875 | 6.984 | 0.997 | 6.984 | 6.963 | ||
| 1.000 | 5.954 | 0.995 | 5.954 | 5.924 | ||
| 1.125 | 5.015 | 0.991 | 5.015 | 4.970 | ||
| 1.250 | 4.197 | 0.987 | 4.197 | 4.142 | ||
| 1.375 | 3.503 | 0.980 | 3.503 | 3.433 | ||
| 1.500 | 2.921 | 0.969 | 2.921 | 2.830 | ||
| 1.675 | 2.438 | 0.954 | 2.438 | 2.326 | ||
| 1.750 | 2.039 | 0.932 | 2.039 | 1.900 | ||
| 1.875 | 1.709 | 0.899 | 1.709 | 1.536 | ||
| 2.000 | 1.437 | 0.854 | 1.437 | 1.227 | ||
| 2.125 | 1.212 | 0.791 | 1.212 | 0.959 | ||
| 2.250 | 1.026 | 0.707 | 1.026 | 0.725 | ||
| 2.375 | 0.873 | 0.602 | 0.873 | 0.526 | ||
| 2.500 | 0.745 | 0.480 | 0.745 | 0.358 | ||
| 2.625 | 0.638 | 0.351 | 0.638 | 0.224 | ||
| 2.750 | 0.550 | 0.230 | 0.550 | 0.127 | ||
| 2.875 | 0.476 | 0.133 | 0.476 | 0.063 | ||
| 3.000 | 0.414 | 0.067 | 0.414 | 0.028 | ||
| 3.125 | 0.362 | 0.030 | 0.362 | 0.011 | ||
| 3.250 | 0.319 | 0.012 | 0.319 | 0.004 | ||
| 3.375 | 0.282 | 0.004 | 0.282 | 0.001 | ||
| 3.500 | 0.252 | 0.001 | 0.252 | 0.000000 | ||
| 3.625 | 0.226 | 0.000000 | 0.226 | 0.000000 | ||
| 3.750 | 0.204 | 0.000000 | 0.204 | 0.000000 | ||
| 3.875 | 0.185 | 0.000000 | 0.185 | 0.000000 | ||
| 4.000 | 0.170 | 0.000000 | 0.170 | 0.000000 | ||
| 4.125 | 0.157 | 0.000000 | 0.157 | 0.000000 | ||
| 4.250 | 0.146 | 0.000000 | 0.146 | 0.000000 | ||
| 4.375 | 0.136 | 0.000000 | 0.136 | 0.000000 | ||
| 4.500 | 0.129 | 0.000000 | 0.129 | 0.000000 | ||
| 4.625 | 0.122 | 0.000000 | 0.122 | 0.000000 | ||
| 4.750 | 0.117 | 0.000000 | 0.117 | 0.000000 | ||
| 4.875 | 0.112 | 0.000000 | 0.112 | 0.000000 | ||
| 5.000 | 0.108 | 0.000000 | 0.108 | 0.000000 | ||
| 5.125 | 0.105 | 0.000000 | 0.105 | 0.000000 | ||
| 5.250 | 0.102 | 0.000000 | 0.102 | 0.000000 | ||
| 5.375 | 0.100 | 0.000000 | 0.100 | 0.000000 | ||
| 5.500 | 0.098 | 0.000000 | 0.098 | 0.000000 | ||
| 5.625 | 0.097 | 0.000000 | 0.097 | 0.000000 | ||
| 5.75 | 0.096 | 0.000000 | 0.096 | 0.000000 | ||
| Csam(exp)= | Cideal(exp)= | 78.539 | ||||
Figure F-1 to Subpart F of Part 53 - Designation Testing Checklist
40:6.0.1.1.1.6.1.8.30 :
Figure F-1 to Subpart F of Part 53 - Designation Testing Checklist DESIGNATION TESTING CHECKLIST FOR CLASS II__________ __________ __________
Auditee Auditor signature Date
| Compliance Status: Y = Yes N = No NA = Not applicable/Not available | Verification Comments (Includes documentation of who, what, where, when, why) (Doc. #, Rev. #, Rev. Date) | |||
|---|---|---|---|---|
| Verification | Verified by Direct Observation of Process or of Documented Evidence: Performance, Design or Application Spec. Corresponding to Sections of 40 CFR Part 53, Subparts E and F | |||
| Y | N | NA | ||
| Subpart E: Performance Specification Tests | ||||
| Evaluation completed according to Subpart E § 53.50 to § 53.56 | ||||
| Subpart E: Class I Sequential Tests | ||||
| Class II samplers that are also Class I (sequentialized) have passed the tests in § 53.57 | ||||
| Subpart F: Performance Spec/Test | ||||
| Evaluation of Physical
Characteristics of Clean Sampler - One of these tests must be
performed: § 53.62 - Full Wind Tunnel § 53.63 - Inlet Aspiration § 53.64 - Static Fractionator |
||||
| Evaluation of Physical
Characteristics of Loaded Sampler § 53.65 Loading Test One of the following tests must be performed for evaluation after loading: § 53.62, § 53.63, § 53.64 |
||||
| Evaluation of the Volatile Characteristics of the Class II Sampler § 53.66 | ||||
Appendix A to Subpart F of Part 53 - References
40:6.0.1.1.1.6.1.8.31 : Appendix A
Appendix A to Subpart F of Part 53 - References(1) Marple, V.A., K.L. Rubow, W. Turner, and J.D. Spangler, Low Flow Rate Sharp Cut Impactors for Indoor Air Sampling: Design and Calibration., JAPCA, 37: 1303-1307 (1987).
(2) Vanderpool, R.W. and K.L. Rubow, Generation of Large, Solid Calibration Aerosols, J. of Aer. Sci. and Tech., 9:65-69 (1988).
(3) Society of Automotive Engineers Aerospace Material Specification (SAE AMS) 2404C, Electroless Nickel Planting, SAE, 400 Commonwealth Drive, Warrendale PA-15096, Revised 7-1-84, pp. 1-6.