Appendix N to Part 50 - Interpretation of the National Ambient Air Quality Standards for PM2.5
40:2.0.1.1.1.0.1.20.15 : Appendix N
Appendix N to Part 50 - Interpretation of the National Ambient Air
Quality Standards for PM2.5 1.0 General
(a) This appendix explains the data handling conventions and
computations necessary for determining when the national ambient
air quality standards (NAAQS) for PM2.5 are met, specifically the
primary and secondary annual and 24-hour PM2.5 NAAQS specified in §
50.7, 50.13, and 50.18. PM2.5 is defined, in general terms, as
particles with an aerodynamic diameter less than or equal to a
nominal 2.5 micrometers. PM2.5 mass concentrations are measured in
the ambient air by a Federal Reference Method (FRM) based on
appendix L of this part, as applicable, and designated in
accordance with part 53 of this chapter; or by a Federal Equivalent
Method (FEM) designated in accordance with part 53 of this chapter;
or by an Approved Regional Method (ARM) designated in accordance
with part 58 of this chapter. Only those FRM, FEM, and ARM
measurements that are derived in accordance with part 58 of this
chapter (i.e., that are deemed “suitable”) shall be used in
comparisons with the PM2.5 NAAQS. The data handling and computation
procedures to be used to construct annual and 24-hour NAAQS metrics
from reported PM2.5 mass concentrations, and the associated
instructions for comparing these calculated metrics to the levels
of the PM2.5 NAAQS, are specified in sections 2.0, 3.0, and 4.0 of
this appendix.
(b) Decisions to exclude, retain, or make adjustments to the
data affected by exceptional events, including natural events, are
made according to the requirements and process deadlines specified
in §§ 50.1, 50.14 and 51.930 of this chapter.
(c) The terms used in this appendix are defined as follows:
Annual mean refers to a weighted arithmetic mean, based
on quarterly means, as defined in section 4.4 of this appendix.
The Air Quality System (AQS) is EPA's official repository
of ambient air data.
Collocated monitors refers to two or more air measurement
instruments for the same parameter (e.g., PM2.5 mass) operated at
the same site location, and whose placement is consistent with §
53.1 of this chapter. For purposes of considering a combined site
record in this appendix, when two or more monitors are operated at
the same site, one monitor is designated as the “primary” monitor
with any additional monitors designated as “collocated.” It is
implicit in these appendix procedures that the primary monitor and
collocated monitor(s) are all deemed suitable for the applicable
NAAQS comparison; however, it is not a requirement that the primary
and monitors utilize the same specific sampling and analysis
method.
Combined site data record is the data set used for
performing calculations in appendix N. It represents data for the
primary monitors augmented with data from collocated monitors
according to the procedure specified in section 3.0(d) of this
appendix.
Creditable samples are daily values in the combined site
record that are given credit for data completeness. The number of
creditable samples (cn) for a given year also governs which value
in the sorted series of daily values represents the 98th percentile
for that year. Creditable samples include daily values collected on
scheduled sampling days and valid make-up samples taken for missed
or invalidated samples on scheduled sampling days.
Daily values refer to the 24-hour average concentrations
of PM2.5 mass measured (or averaged from hourly measurements in
AQS) from midnight to midnight (local standard time) from suitable
monitors.
Data substitution tests are diagnostic evaluations
performed on an annual PM2.5 NAAQS design value (DV) or a 24-hour
PM2.5 NAAQS DV to determine if those metrics, which are judged to
be based on incomplete data in accordance with 4.1(b) or 4.2(b) of
this appendix shall nevertheless be deemed valid for NAAQS
comparisons, or alternatively, shall still be considered incomplete
and not valid for NAAQS comparisons. There are two data
substitution tests, the “minimum quarterly value” test and the
“maximum quarterly value” test. Design values (DVs) are the
3-year average NAAQS metrics that are compared to the NAAQS levels
to determine when a monitoring site meets or does not meet the
NAAQS, calculated as shown in section 4. There are two separate DVs
specified in this appendix:
(1) The 3-year average of PM2.5 annual mean mass concentrations
for each eligible monitoring site is referred to as the “annual
PM2.5 NAAQS DV”.
(2) The 3-year average of annual 98th percentile 24-hour average
PM2.5 mass concentration values recorded at each eligible
monitoring site is referred to as the “24-hour (or daily)
PM2.5 NAAQS DV”.
Eligible sites are monitoring stations that meet the
criteria specified in § 58.11 and § 58.30 of this chapter, and thus
are approved for comparison to the annual PM2.5 NAAQS. For the
24-hour PM2.5 NAAQS, all site locations that meet the criteria
specified in § 58.11 are approved (i.e., eligible) for NAAQS
comparisons.
Extra samples are non-creditable samples. They are daily
values that do not occur on scheduled sampling days and that cannot
be used as make-up samples for missed or invalidated scheduled
samples. Extra samples are used in mean calculations and are
included in the series of all daily values subject to selection as
a 98th percentile value, but are not used to determine which value
in the sorted list represents the 98th percentile.
Make-up samples are samples collected to take the place
of missed or invalidated required scheduled samples. Make-up
samples can be made by either the primary or the collocated
monitor. Make-up samples are either taken before the next required
sampling day or exactly one week after the missed (or voided)
sampling day.
The maximum quarterly value data substitution test
substitutes actual “high” reported daily PM2.5 values from the same
site (specifically, the highest reported non-excluded quarterly
value(s) (year non-specific) contained in the combined site record
for the evaluated 3-year period) for missing daily values.
The minimum quarterly value data substitution test
substitutes actual “low” reported daily PM2.5 values from the same
site (specifically, the lowest reported quarterly value(s) (year
non-specific) contained in the combined site record for the
evaluated 3-year period) for missing daily values.
98th percentile is the smallest daily value out of a year
of PM2.5 mass monitoring data below which no more than 98 percent
of all daily values fall using the ranking and selection method
specified in section 4.5(a) of this appendix.
Primary monitors are suitable monitors designated by a
state or local agency in their annual network plan (and in AQS) as
the default data source for creating a combined site record for
purposes of NAAQS comparisons. If there is only one suitable
monitor at a particular site location, then it is presumed to be a
primary monitor.
Quarter refers to a calendar quarter (e.g., January
through March).
Quarterly data capture rate is the percentage of
scheduled samples in a calendar quarter that have corresponding
valid reported sample values. Quarterly data capture rates are
specifically calculated as the number of creditable samples for the
quarter divided by the number of scheduled samples for the quarter,
the result then multiplied by 100 and rounded to the nearest
integer.
Scheduled PM2.5 samples refers to those reported
daily values which are consistent with the required sampling
frequency (per § 58.12 of this chapter) for the primary monitor, or
those that meet the special exception noted in section 3.0(e) of
this appendix.
Seasonal sampling is the practice of collecting data at a
reduced frequency during a season of expected low
concentrations.
Suitable monitors are instruments that use sampling and
analysis methods approved for NAAQS comparisons. For the annual and
24-hour PM2.5 NAAQS, suitable monitors include all FRMs, and all
FEMs/ARMs except those specific continuous FEMs/ARMs disqualified
by a particular monitoring agency network in accordance with §
58.10(b)(13) and approved by the EPA Regional Administrator per §
58.11(e) of this chapter.
Test design values (TDV) are numerical values that used
in the data substitution tests described in sections 4.1(c)(i),
4.1(c)(ii) and 4.2(c)(i) of this appendix to determine if the PM2.5
NAAQS DV with incomplete data are judged to be valid for NAAQS
comparisons. There are two TDVs: TDVmin to determine if the NAAQS
is not met and is used in the “minimum quarterly value” data
substitution test and TDVmax to determine if the NAAQS is met and
is used in the “maximum quarterly value” data substitution test.
These TDV's are derived by substituting historically low or
historically high daily concentration values for missing data in an
incomplete year(s).
Year refers to a calendar year.
2.0 Monitoring Considerations
(a) Section 58.30 of this chapter provides special
considerations for data comparisons to the annual PM2.5 NAAQS.
(b) Monitors meeting the network technical requirements detailed
in § 58.11 of this chapter are suitable for comparison with the
NAAQS for PM2.5.
(c) Section 58.12 of this chapter specifies the required minimum
frequency of sampling for PM2.5. Exceptions to the specified
sampling frequencies, such as seasonal sampling, are subject to the
approval of the EPA Regional Administrator and must be documented
in the state or local agency Annual Monitoring Network Plan as
required in § 58.10 of this chapter and also in AQS.
3.0 Requirements for Data Use and Data Reporting for Comparisons
With the NAAQS for PM2.5
(a) Except as otherwise provided in this appendix, all valid
FRM/FEM/ARM PM2.5 mass concentration data produced by suitable
monitors that are required to be submitted to AQS, or otherwise
available to EPA, meeting the requirements of part 58 of this
chapter including appendices A, C, and E shall be used in the DV
calculations. Generally, EPA will only use such data if they have
been certified by the reporting organization (as prescribed by §
58.15 of this chapter); however, data not certified by the
reporting organization can nevertheless be used, if the deadline
for certification has passed and EPA judges the data to be complete
and accurate.
(b) PM2.5 mass concentration data (typically collected hourly
for continuous instruments and daily for filter-based instruments)
shall be reported to AQS in micrograms per cubic meter (µg/m 3) to
at least one decimal place. If concentrations are reported to one
decimal place, additional digits to the right of the tenths decimal
place shall be truncated. If concentrations are reported to AQS
with more than one decimal place, AQS will truncate the value to
one decimal place for NAAQS usage (i.e., for implementing the
procedures in this appendix). In situations where suitable PM2.5
data are available to EPA but not reported to AQS, the same
truncation protocol shall be applied to that data. In situations
where PM2.5 mass data are submitted to AQS, or are otherwise
available, with less precision than specified above, these data
shall nevertheless still be deemed appropriate for NAAQS usage.
(c) Twenty-four-hour average concentrations will be computed in
AQS from submitted hourly PM2.5 concentration data for each
corresponding day of the year and the result will be stored in the
first, or start, hour (i.e., midnight, hour ‘0’) of the 24-hour
period. A 24-hour average concentration shall be considered valid
if at least 75 percent of the hourly averages (i.e., 18 hourly
values) for the 24-hour period are available. In the event that
less than all 24 hourly average concentrations are available (i.e.,
less than 24, but at least 18), the 24-hour average concentration
shall be computed on the basis of the hours available using the
number of available hours within the 24-hour period as the divisor
(e.g., 19, if 19 hourly values are available). Twenty-four-hour
periods with seven or more missing hours shall also be considered
valid if, after substituting zero for all missing hourly
concentrations, the resulting 24-hour average daily value is
greater than the level of the 24-hour PM2.5 NAAQS (i.e., greater
than or equal to 35.5 µg/m 3). Twenty-four hour average PM2.5 mass
concentrations that are averaged in AQS from hourly values will be
truncated to one decimal place, consistent with the data handling
procedure for the reported hourly (and also 24-hour filter-based)
data.
(d) All calculations shown in this appendix shall be implemented
on a site-level basis. Site level concentration data shall be
processed as follows:
(1) The default dataset for PM2.5 mass concentrations for a site
shall consist of the measured concentrations recorded from the
designated primary monitor(s). All daily values produced by the
primary monitor are considered part of the site record; this
includes all creditable samples and all extra samples.
(2) Data for the primary monitors shall be augmented as much as
possible with data from collocated monitors. If a valid daily value
is not produced by the primary monitor for a particular day
(scheduled or otherwise), but a value is available from a
collocated monitor, then that collocated value shall be considered
part of the combined site data record. If more than one collocated
daily value is available, the average of those valid collocated
values shall be used as the daily value. The data record resulting
from this procedure is referred to as the “combined site data
record.”
(e) All daily values in a combined site data record are used in
the calculations specified in this appendix; however, not all daily
values are given credit towards data completeness requirements.
Only creditable samples are given credit for data completeness.
Creditable samples include daily values in the combined site record
that are collected on scheduled sampling days and valid make-up
samples taken for missed or invalidated samples on scheduled
sampling days. Days are considered scheduled according to the
required sampling frequency of the designated primary monitor with
one exception. The exception is, if a collocated continuous FEM/ARM
monitor has a more intensive sampling frequency than the primary
FRM monitor, then samples contributed to the combined site record
from that continuous FEM/ARM monitor are always considered
scheduled and, hence, also creditable. Daily values in the combined
site data record that are reported for nonscheduled days, but that
are not valid make-up samples are referred to as extra samples.
4.0 Comparisons With the Annual and 24-Hour PM2.5 NAAQS 4.1 Annual
PM2.5 NAAQS
(a) The primary annual PM2.5 NAAQS is met when the annual PM2.5
NAAQS DV is less than or equal to 12.0 µg/m 3 at each eligible
monitoring site. The secondary annual PM2.5 NAAQS is met when the
annual PM2.5 NAAQS DV is less than or equal to 15.0 µg/m 3 at each
eligible monitoring site.
(b) Three years of valid annual means are required to produce a
valid annual PM2.5 NAAQS DV. A year meets data completeness
requirements when quarterly data capture rates for all four
quarters are at least 75 percent. However, years with at least 11
creditable samples in each quarter shall also be considered valid
if the resulting annual mean or resulting annual PM2.5 NAAQS DV
(rounded according to the conventions of section 4.3 of this
appendix) is greater than the level of the applicable primary or
secondary annual PM2.5 NAAQS. Furthermore, where the explicit 75
percent data capture and/or 11 sample minimum requirements are not
met, the 3-year annual PM2.5 NAAQS DV shall still be considered
valid if it passes at least one of the two data substitution tests
stipulated below.
(c) In the case of one, two, or three years that do not meet the
completeness requirements of section 4.1(b) of this appendix and
thus would normally not be useable for the calculation of a valid
annual PM2.5 NAAQS DV, the annual PM2.5 NAAQS DV shall nevertheless
be considered valid if one of the test conditions specified in
sections 4.1(c)(i) and 4.1(c)(ii) of this appendix is met.
(i) An annual PM2.5 NAAQS DV that is above the level of the
NAAQS can be validated if it passes the minimum quarterly value
data substitution test. This type of data substitution is permitted
only if there are at least 30 days across the three quarters of the
three years under consideration (e.g., collectively, quarter 1 of
year 1, quarter 1 of year 2 and quarter 1 of year 3) from which to
select the quarter-specific low value. Data substitution will be
performed in all quarter periods that have less than 11 creditable
samples.
Procedure: Identify for each deficient quarter (i.e.,
those with less than 11 creditable samples) the lowest reported
daily value for that quarter, looking across those three months of
all three years under consideration. If after substituting the
lowest reported daily value for a quarter for (11− cn) daily values
in the matching deficient quarter(s) (i.e., to bring the creditable
number for those quarters up to 11), the procedure yields a
recalculated annual PM2.5 NAAQS test DV (TDVmin) that is greater
than the level of the standard, then the annual PM2.5 NAAQS DV is
deemed to have passed the diagnostic test and is valid, and the
annual PM2.5 NAAQS is deemed to have been violated in that 3-year
period.
(ii) An annual PM2.5 NAAQS DV that is equal to or below the
level of the NAAQS can be validated if it passes the maximum
quarterly value data substitution test. This type of data
substitution is permitted only if there is at least 50 percent data
capture in each quarter that is deficient of 75 percent data
capture in each of the three years under consideration. Data
substitution will be performed in all quarter periods that have
less than 75 percent data capture but at least 50 percent data
capture. If any quarter has less than 50 percent data capture then
this substitution test cannot be used.
Procedure: Identify for each deficient quarter (i.e.,
those with less than 75 percent but at least 50 percent data
capture) the highest reported daily value for that quarter,
excluding state-flagged data affected by exceptional events which
have been approved for exclusion by the Administrator, looking
across those three quarters of all three years under consideration.
If after substituting the highest reported daily PM2.5 value for a
quarter for all missing daily data in the matching deficient
quarter(s) (i.e., to make those quarters 100 percent complete), the
procedure yields a recalculated annual PM2.5 NAAQS test DV (TDVmax)
that is less than or equal to the level of the standard, then the
annual PM2.5 NAAQS DV is deemed to have passed the diagnostic test
and is valid, and the annual PM2.5 NAAQS is deemed to have been met
in that 3-year period.
(d) An annual PM2.5 NAAQS DV based on data that do not meet the
completeness criteria stated in 4(b) and also do not satisfy the
test conditions specified in section 4(c), may also be considered
valid with the approval of, or at the initiative of, the EPA
Administrator, who may consider factors such as monitoring site
closures/moves, monitoring diligence, the consistency and levels of
the daily values that are available, and nearby concentrations in
determining whether to use such data.
(e) The equations for calculating the annual PM2.5 NAAQS DVs are
given in section 4.4 of this appendix.
4.2 Twenty-four-hour PM2.5 NAAQS
(a) The primary and secondary 24-hour PM2.5 NAAQS are met when
the 24-hour PM2.5 NAAQS DV at each eligible monitoring site is less
than or equal to 35 µg/m 3.
(b) Three years of valid annual PM2.5 98th percentile mass
concentrations are required to produce a valid 24-hour PM2.5 NAAQS
DV. A year meets data completeness requirements when quarterly data
capture rates for all four quarters are at least 75 percent.
However, years shall be considered valid, notwithstanding quarters
with less than complete data (even quarters with less than 11
creditable samples, but at least one creditable sample must be
present for the year), if the resulting annual 98th percentile
value or resulting 24-hour NAAQS DV (rounded according to the
conventions of section 4.3 of this appendix) is greater than the
level of the standard. Furthermore, where the explicit 75 percent
quarterly data capture requirement is not met, the 24-hour PM2.5
NAAQS DV shall still be considered valid if it passes the maximum
quarterly value data substitution test.
(c) In the case of one, two, or three years that do not meet the
completeness requirements of section 4.2(b) of this appendix and
thus would normally not be useable for the calculation of a valid
24-hour PM2.5 NAAQS DV, the 24-hour PM2.5 NAAQS DV shall
nevertheless be considered valid if the test conditions specified
in section 4.2(c)(i) of this appendix are met.
(i) A PM2.5 24-hour mass NAAQS DV that is equal to or below the
level of the NAAQS can be validated if it passes the maximum
quarterly value data substitution test. This type of data
substitution is permitted only if there is at least 50 percent data
capture in each quarter that is deficient of 75 percent data
capture in each of the three years under consideration. Data
substitution will be performed in all quarters that have less than
75 percent data capture but at least 50 percent data capture. If
any quarter has less than 50 percent data capture then this
substitution test cannot be used.
Procedure: Identify for each deficient quarter (i.e.,
those with less than 75 percent but at least 50 percent data
capture) the highest reported daily PM2.5 value for that quarter,
excluding state-flagged data affected by exceptional events which
have been approved for exclusion by the Regional Administrator,
looking across those three quarters of all three years under
consideration. If, after substituting the highest reported daily
maximum PM2.5 value for a quarter for all missing daily data in the
matching deficient quarter(s) (i.e., to make those quarters 100
percent complete), the procedure yields a recalculated 3-year
24-hour NAAQS test DV (TDVmax) less than or equal to the level of
the standard, then the 24-hour PM2.5 NAAQS DV is deemed to have
passed the diagnostic test and is valid, and the 24-hour PM2.5
NAAQS is deemed to have been met in that 3-year period.
(d) A 24-hour PM2.5 NAAQS DV based on data that do not meet the
completeness criteria stated in section 4(b) of this appendix and
also do not satisfy the test conditions specified in section 4(c)
of this appendix, may also be considered valid with the approval
of, or at the initiative of, the EPA Administrator, who may
consider factors such as monitoring site closures/moves, monitoring
diligence, the consistency and levels of the daily values that are
available, and nearby concentrations in determining whether to use
such data.
(e) The procedures and equations for calculating the 24-hour
PM2.5 NAAQS DVs are given in section 4.5 of this appendix.
4.3 Rounding Conventions. For the purposes of comparing
calculated PM2.5 NAAQS DVs to the applicable level of the standard,
it is necessary to round the final results of the calculations
described in sections 4.4 and 4.5 of this appendix. Results for all
intermediate calculations shall not be rounded.
(a) Annual PM2.5 NAAQS DVs shall be rounded to the nearest tenth
of a µg/m 3 (decimals x.x5 and greater are rounded up to the next
tenth, and any decimal lower than x.x5 is rounded down to the
nearest tenth).
(b) Twenty-four-hour PM2.5 NAAQS DVs shall be rounded to the
nearest 1 µg/m 3 (decimals 0.5 and greater are rounded up to the
nearest whole number, and any decimal lower than 0.5 is rounded
down to the nearest whole number).
4.4 Equations for the Annual PM2.5 NAAQS.
(a) An annual mean value for PM2.5 is determined by first
averaging the daily values of a calendar quarter using equation 1
of this appendix:
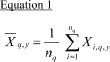
Where: X
q,y = the mean for quarter q of the year y; nq = the number of
daily values in the quarter; and xi q,y = the i th value in quarter
q for year y.
(b) Equation 2 of this appendix is then used to calculate the
site annual mean:
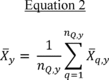
Where: Xy
= the annual mean concentration for year
y (
y = 1, 2,
or 3);
nQ,y = the number of quarters Q in year y with at
least one daily value; and Xq,y = the mean for quarter
q of
year
y (result of equation 1).
(c) The annual PM2.5 NAAQS DV is calculated using equation 3 of
this appendix:

Where: X
= the annual PM2.5 NAAQS DV; and X y = the annual mean for year
y (result of equation 2)
(d) The annual PM2.5 NAAQS DV is rounded according to the
conventions in section 4.3 of this appendix before comparisons with
the levels of the primary and secondary annual PM2.5 NAAQS are
made.
4.5 Procedures and Equations for the 24-Hour PM2.5 NAAQS
(a) When the data for a particular site and year meet the data
completeness requirements in section 4.2 of this appendix,
calculation of the 98th percentile is accomplished by the steps
provided in this subsection. Table 1 of this appendix shall be used
to identify annual 98th percentile values.
Identification of annual 98th percentile values using the Table
1 procedure will be based on the creditable number of samples (as
described below), rather than on the actual number of samples.
Credit will not be granted for extra (non-creditable) samples.
Extra samples, however, are candidates for selection as the annual
98th percentile. [The creditable number of samples will determine
how deep to go into the data distribution, but all samples
(creditable and extra) will be considered when making the
percentile assignment.] The annual creditable number of samples is
the sum of the four quarterly creditable number of samples.
Procedure: Sort all the daily values from a particular
site and year by descending value. (For example: (x[1], x[2], x[3],
* * *, x[n]). In this case, x[1] is the largest number and x[n] is
the smallest value.) The 98th percentile value is determined from
this sorted series of daily values which is ordered from the
highest to the lowest number. Using the left column of Table 1,
determine the appropriate range for the annual creditable number of
samples for year y (cny) (e.g., for 120 creditable samples per
year, the appropriate range would be 101 to 150). The corresponding
“n” value in the right column identifies the rank of the annual
98th percentile value in the descending sorted list of site
specific daily values for year y (e.g., for the range of 101 to
150, n would be 3). Thus, P0.98, y = the n th largest value (e.g.,
for the range of 101 to 150, the 98th percentile value would be the
third highest value in the sorted series of daily values.
| Annual number of creditable
samples for year y (cny) |
The 98th percentile for year
y (P0.98,y), is the n th maximum 24-hour average value
for the year where n is the listed number |
| 1 to 50 |
1 |
| 51 to 100 |
2 |
| 101 to 150 |
3 |
| 151 to 200 |
4 |
| 201 to 250 |
5 |
| 251 to 300 |
6 |
| 301 to 350 |
7 |
| 351 to 366 |
8 |
(b) The 24-hour PM2.5 NAAQS DV is then calculated by averaging
the annual 98th percentiles using equation 4 of this appendix:
P0.98,y

Where:
P 0.98 = the 24-hour PM2.5 NAAQS DV; and
P0.98, y = the annual 98th percentile for year
y
(c) The 24-hour PM2.5 NAAQS DV is rounded according to the
conventions in section 4.3 of this appendix before a comparison
with the level of the primary and secondary 24-hour NAAQS are
made.
[78 FR 3277, Jan. 15, 2013, as amended at 82 FR 14327, Mar. 20,
2017]